In Part 1 of this series about AWS Compute Optimizer, we provided a brief overview of AWS instance types and examined the various EC2 dimensions that should be considered when designing a cloud environment. We discussed how different workload needs can lead to the use of different instance types as well as how an improperly designed cloud infrastructure can lead to unnecessary spending and suboptimal application performance (we advise having a planned 3 part phase to avoid this). Finally, Part 1 took a look at AWS Compute Optimizer, a new service released during the last re:Invent conference that uses machine learning to analyze cloud computing environments. This very useful free tool provides recommendations designed to help you make your cloud environment more efficient.
This article presents a complete how-to guide for setting up AWS Compute Optimizer and understanding its analyses and recommendations.
AWS Compute Optimizer: A How-To Guide
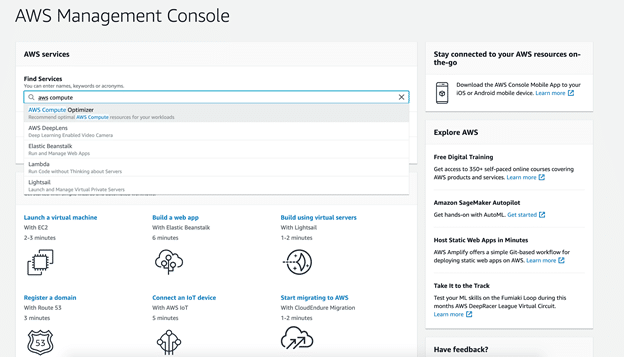
To get started with AWS Compute Optimizer, open your AWS web console, and look for the service.
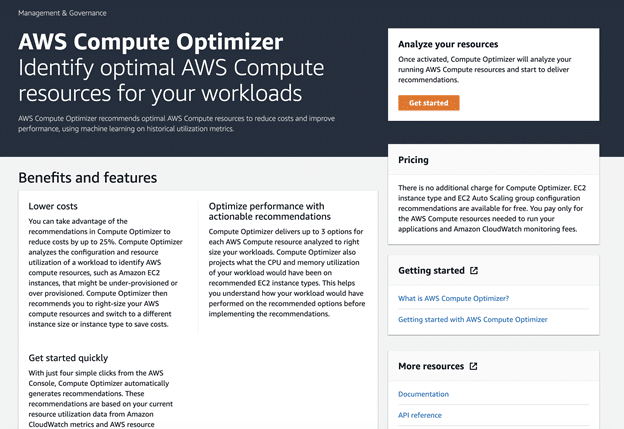
Once you open it, you’ll be greeted with the Compute Optimizer landing page, which shows you some of the tool’s features and benefits. The pricing structure is also presented here. This service comes with no cost attached, because, as is typically the case with AWS, you only pay for the compute resources that you actually use.
From this landing page, you can also access the documentation page. Here, we’re interested in using Compute Optimizer, so click on the “Get started” button.
Before you can use this tool, you have to opt in. What this means is that a new service-linked role will be created in your account. This will allow Compute Optimizer to access the resources and CloudWatch metrics needed for its analysis.
In order to have as detailed an analysis as possible, you might want to enable memory metrics on your EC2 instances. This requires you to install Amazon CloudWatch agents. Keep in mind that additional cost can be incurred by enabling this feature.
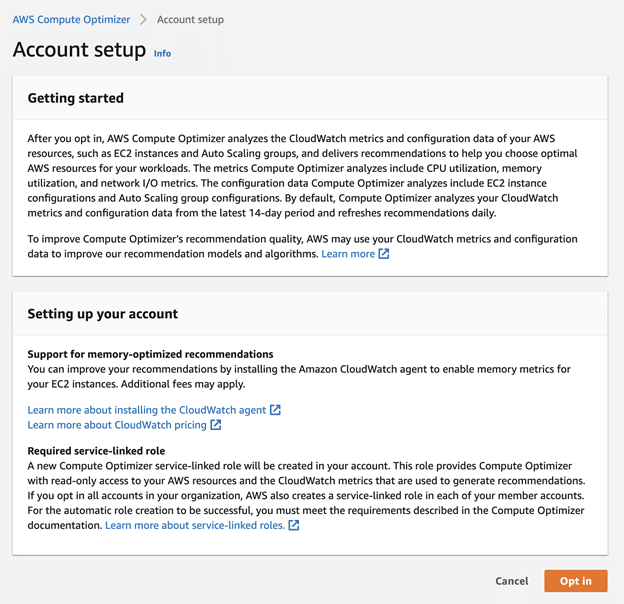
Before you opt in, you need to make sure that you actually have the permissions necessary to do so. If you are using the root access (as the account owner) or an admin level access, you’re ready to go. Otherwise, you might need to ask for additional permissions or add them yourself within Identity and Access Management.
When you’re ready, click the “Opt in” button. The AWS Compute Optimizer dashboard will then open, and you’ll be informed that it can take up to 12 hours to collect information from your account and perform the initial analysis.

When the analysis has been completed, your AWS Compute Optimizer dashboard will update, looking something like this:
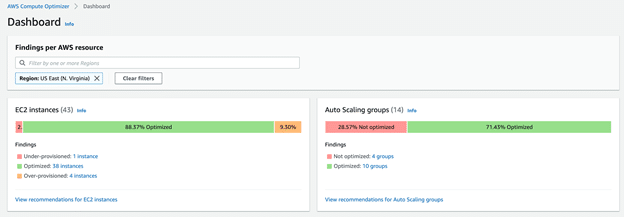
As you can see, Compute Optimizer provides separate analyses for EC2 instances and for Auto Scaling groups.
Your EC2 instances can be:
- Optimized. In this case, all specifications, such as CPU, memory, and network, meet the performance requirements of your specific workload, providing you with optimal performance and infrastructure cost.
- Over-provisioned. If you see this label, at least one of the specifications, such as CPU, memory, or network, can be scaled down without any negative effect on your performance requirements. Over-provisioned instances lead to unnecessary infrastructure costs and are often the primary causes of high AWS bills.
- Under-provisioned. When this is the assessment, at least one of specifications, such as CPU, memory, or network, needs to be scaled up in order to meet your performance requirements. Under-provisioned instances cause poor application performance.
For Auto Scaling groups, findings are grouped into two categories:
- Optimized. An Auto Scaling group is considered optimized when, according to Compute Optimizer’s calculations, it is properly provisioned for your required workload based on the chosen instance type.
- Not optimized. An Auto Scaling group is considered to be not optimized when Compute Optimizer identifies recommendations that can either improve performance or reduce your costs.
Let’s take a look at the recommendations. When you click on “View recommendations for EC2 instances,” you will see a page like this:
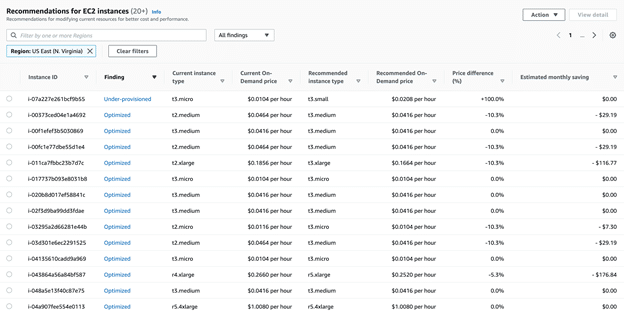
The second column of the table shows whether or not each of your instances is optimized. In our case, we have one under-provisioned instance; everything else is optimized. The third and fourth columns show the current instance type and its hourly cost, and the fifth column shows the recommended instance type. The last two columns show the price difference (expressed as a percentage) between the currently used instance and the recommended instance and the estimated monthly savings that would be achieved if the new instance type were applied.
You can click on the settings button in the top right corner to see more columns. These additional columns show information about on-demand hours, reserved instance hours, and RI coverage, for example.
The first instance on our list, the one running on t3.micro, is under-provisioned. The recommendation is to move to a t3.small instance. This would effectively double the instance’s cost, as illustrated by the price difference of +100%. However, analysis showed that this instance is not running your workload optimally, so, unless cost is a big concern, this instance should be scaled up.
While our other instances are optimized, there are some minor recommendations for them. For example, although the second instance on our list is optimized, it is running the previous generation t2.medium instance. The analysis here shows that by moving it to the next generation t3.medium instance, we can save $29.19 each month. Further down the list is a similar example, where moving from r4.xlarge to r5.xlarge would save $176.84. These savings can quickly add up, especially in larger cloud environments.
If you’re looking for more detailed information about these recommendations, you can select the instance and click on “View details.” This will show you your options. If there’s more than one, you can compare them by looking at the metrics data, an example of which you can see in the screenshot below.
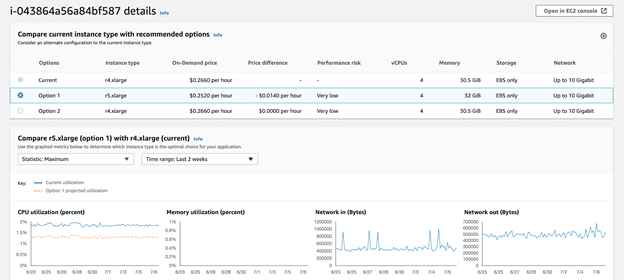
In addition to illustrating the price differences associated with your utilization changes, Compute Optimizer will also show you potential performance risks. The metrics used to assess risk are CPU utilization, network in and out, and memory utilization (which requires you to install Amazon CloudWatch agents on your EC2 instances in order to work).
You can export all of these recommendations for further use and analysis. Select the instance you want, and click on “Action and Export recommendations.”
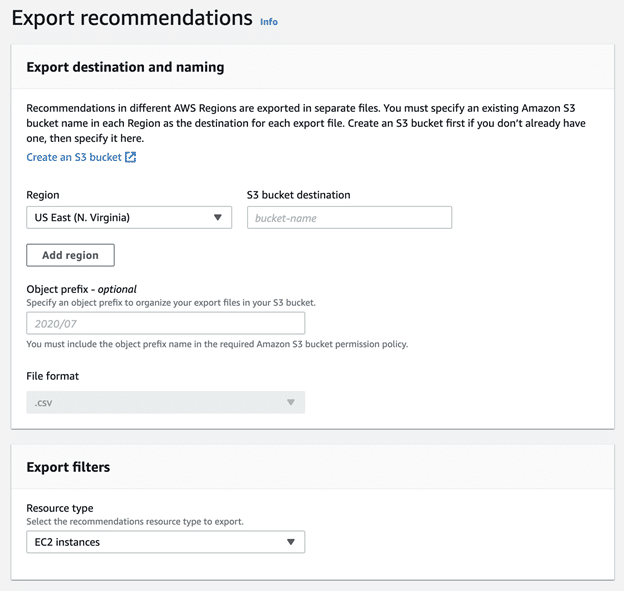
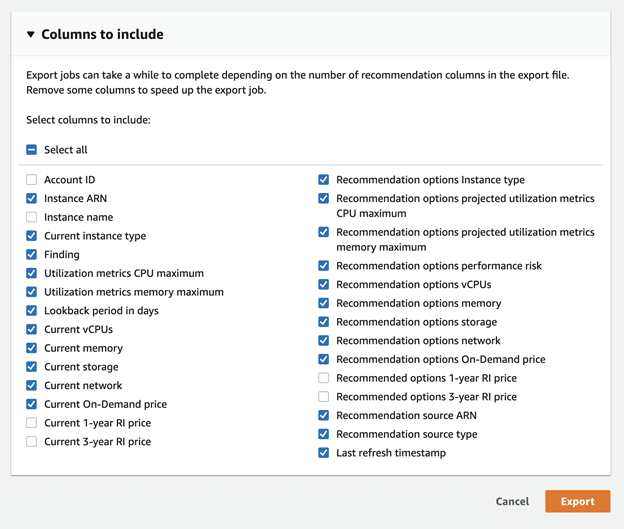
You have the option to export these recommendations as a .csv file to an S3 bucket of your choosing. Select the columns that you might need to look at later on.
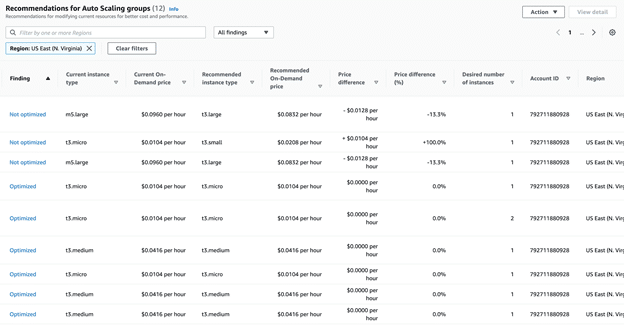
If you go back to the Compute Optimizer dashboard and open “View recommendations for Auto Scaling groups,” you’ll see that the data and recommendations are presented in the same way. The same options for viewing and exporting the information are available.
No reason not to use AWS Compute Optimizer
In this two-part article series, we’ve examined what AWS Compute Optimizer does and how you can use it to optimize your environment. This how-to guide provided a step-by-step description for setting up this service and using its recommendations to reduce the cost of your cloud environment and ensure the optimal performance of your applications. This service is a great addition to the already vast array of AWS offerings. Since it’s free, there’s absolutely no reason not to use it!
Try N2WS Backup & Recovery for FREE!
Read Also
