
Proper monitoring is an absolute must for any business environment, whether it is running on-premises or in one of the public clouds. When you are monitoring your infrastructure and applications effectively, you have an insight into how things are working at all times because the CPU usage of your servers, your network congestion, the requests toward your load balancer, and the number of 5xx errors that have been returned by your application all give you information about the status and overall health of your environment, not to mention help you cut out excessive cloud spend. There are many different monitoring products out there (Datadog for example), each with its own price point, and each is designed to cater to a specific requirement. This blog post will focus on Amazon’s public cloud and look at their monitoring service, AWS CloudWatch. In this two-part article, we will look at what AWS CloudWatch is, how it works, how much it costs, and what it can offer to you. We will also consider some use cases that you might find helpful in your business environment.
Monitoring not only allows you to minimize downtime when something undesired occurs (or, better yet, help you avoid it altogether), it also drives value by showing you the level of optimization of every system component. This is especially important when working with public clouds where you pay for usage and can drastically reduce your operational expenses by identifying inefficient usage.
What Is AWS CloudWatch?
AWS CloudWatch is a monitoring service that allows you a detailed insight into your cloud environment. You can install CloudWatch agents on your on-premises servers if needed, making it a viable tool for hybrid cloud solutions as well. CloudWatch helps you monitor your infrastructure and applications as well as other AWS services by collecting metrics, logs, and events. These can be used to create dashboards for visualization, and they can also be set up with various alarms that will notify you (or be part of an automated response system) when certain thresholds are passed. These thresholds can range from something like scaling up or down EC2 instances within an Auto Scaling Group when usage is too low or too high to being notified when you are about to go over your monthly spending budget. AWS Instance Scheduler also involves Cloudwatch, used to custom configure automatic start and stop of EC2 instances. Additionally, using CloudWatch, you can schedule EBS backups, receive notifications when your instances have been terminated, or be alerted to the degradation of hardware that could potentially affect your RDS databases.
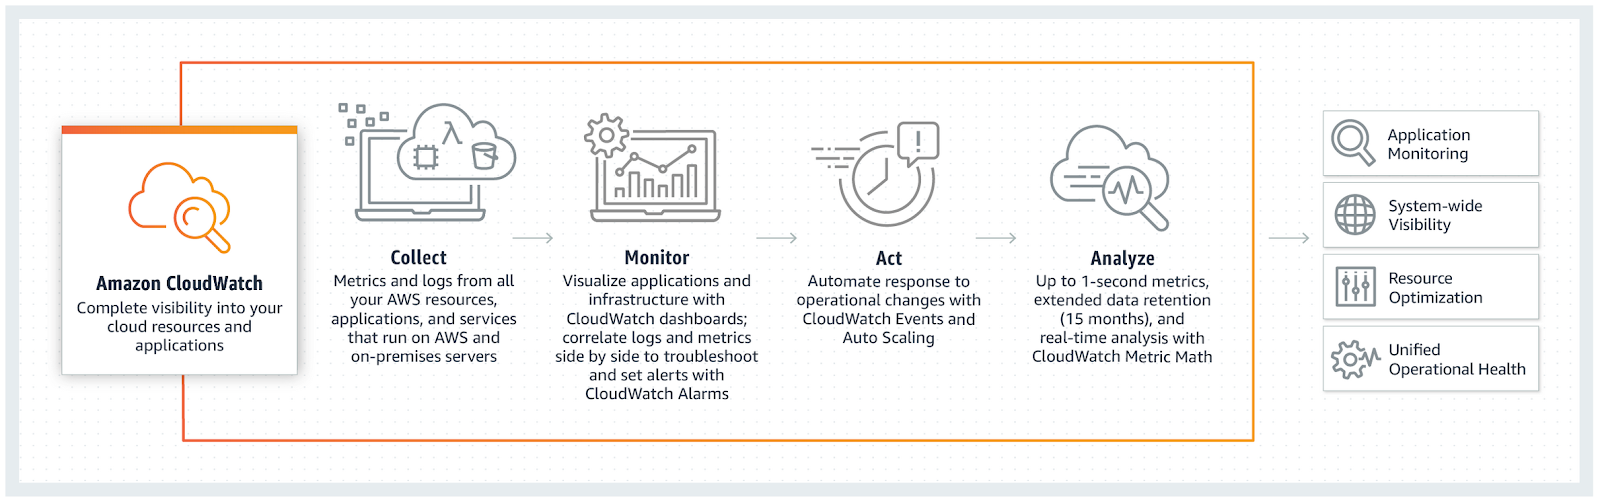
Because CloudWatch is an AWS service, it is natively integrated with other AWS services–over 70 of them at present, ranging from EC2 and S3 to Lambda and EKS—and provides a central location for collecting and monitoring data. The data received from these sources can be very granular, and, while standard one-minute collection is most frequently used, you can have custom one-second metrics delivered if your business requires them. These metrics can be retained for as long as 15 months.
AWS CloudWatch Pricing
As with other AWS services, CloudWatch is priced per usage, billed at the end of the month. There is also a free tier which is very useful for those working their way around AWS for the first time.
CloudWatch metrics cost $0.30 per metric per month for the first 10,000 metrics. After that, you pay $0.10 per metric for the next 240,000. Between 240,000 and 1,000,000 metrics, the price is set at $0.05. Everything over that costs only $0.02 per metric.
Logs are priced at $0.50 per GB for ingestion and $0.03 per GB for storage. Note that if you want to pull the logs, data transfer costs will be incurred.
CloudWatch alarms cost $0.10 per alarm metric for standard resolution (evaluation happens as frequently as every 60 seconds), or $0.30 per alarm metric for high resolution (evaluation happens every 10 seconds).
CloudWatch dashboards run $3.00 per dashboard per month, and CloudWatch events cost $1.00 per one million events.
CloudWatch Pros and Cons
Like any other tool on the market, CloudWatch has its pros and cons. Starting with the cons, CloudWatch alerts are somewhat hard to work with if you are not experienced with AWS. Making alerts is not very intuitive, so setting them up the first time can require a bit of trial and error. Additionally, there is no way to expose the alerts for further analysis. Compared to some third-party tools like SysDig or DataDog, CloudWatch’s features can seem rudimentary.
However, for those relying on AWS, CloudWatch is an integral part of your environment. Being a native AWS service, CloudWatch has insight and access into everything, and while the platform may be lacking in some areas, it does enable you to properly monitor your cloud environment. Since it is fairly cheap for what it does, there is really no reason not to use it. If you would like to use features that are not supported by CloudWatch, you can augment it with third-party tools on the market.
Recent Updates to AWS CloudWatch
Since its introduction, CloudWatch has undergone a lot of updates that have introduced new features and improvements. Within the last 12 months alone, CloudWatch added support for alarms that are based on math expression metrics as well as Amazon FSx for Windows File Server performance monitoring, Container Insights for Amazon ECS and EKS, and CloudWatch Anomaly Detection (machine learning-based system analysis used to troubleshoot metric behavior).
CloudWatch also built a new home page, which, by default, displays all of the key metrics and alarms for your AWS services.
AWS CloudWatch Or CloudTrail: Which One Do You Need?
Although both of these services deal with logs, they serve two different purposes. CloudWatch is a monitoring service which focuses on your cloud environment’s health by logging performance metrics, events, service status reports, etc. CloudTrail, on the other hand, is an auditing service meant to help you ensure that your business complies with external regulations. While CloudWatch focuses on the cloud environment itself, CloudTrail looks at the AWS API calls (through the console, CLI, or SDK) and who made them. In doing so, it provides a much deeper insight into user activity within your environment.
Of course, you can use both of these platforms together. You can, for example, have your CloudTrail logs streamed to CloudWatch Logs. This will help you to avoid waiting for CloudTrail batches to arrive, creating a more efficient solution for processing CloudTrail events.
Getting the most out of AWS CloudWatch
In this article, part one of a two-part series, CloudWatch and its purpose within the AWS ecosystem was reviewed. We deep dove into its pricing, its benefits and drawbacks, and how it compares to CloudTrail.
Part two will examine CloudWatch’s components, looking into its metrics and dimensions, dashboard, events, alarms, and logs. It will also provide you with some practical use cases for CloudWatch, offering solutions that you can easily add to your own AWS environment.