
Back in Part 1 of our CloudWatch blog series, we provided an overview of CloudWatch, an AWS service used for monitoring entire cloud environments. We covered in great detail the pros and cons of CloudWatch, the various tiers of CloudWatch pricing and the most recent updates to the service that have significantly improved its usability. We also did a comparison of CloudWatch and CloudTrail and how to use them together.
In this second and final part, we’ll take a look at all of CloudWatch’s sister services, including metrics, dimensions, logs, dashboards, alarms, and events. We’ll describe how to use these features and understand how to get the most out of the service by considering some practical use cases. Because CloudWatch has many components each with distinct benefits and can be used to monitor both your infrastructure as well as other AWS services, understanding how it works for you is critical.
CloudWatch’s Offerings: A Component Overview
As mentioned above, CloudWatch consists of multiple different sister services, each designed to help you monitor and respond to your cloud environment. These components are examined below.
Metrics and Dimensions
CloudWatch metrics are data points that show the performance of the monitored system. They are time ordered and published to CloudWatch, and, by default, you receive lots of free metrics, such as EC2 instances, EBS volumes, and RDS databases from various AWS services. These metrics are aggregated and can be used for searching, graphing, or even creating alarms. You can also publish custom metrics if what AWS provides is not enough.
Each metric is unique. It has a name, a namespace, and an optional dimension. Dimensions are simply name/value pairs that help to identify the category of the metric.
By looking at the metrics page on the CloudWatch dashboard, you can see the list of existing metrics being published.
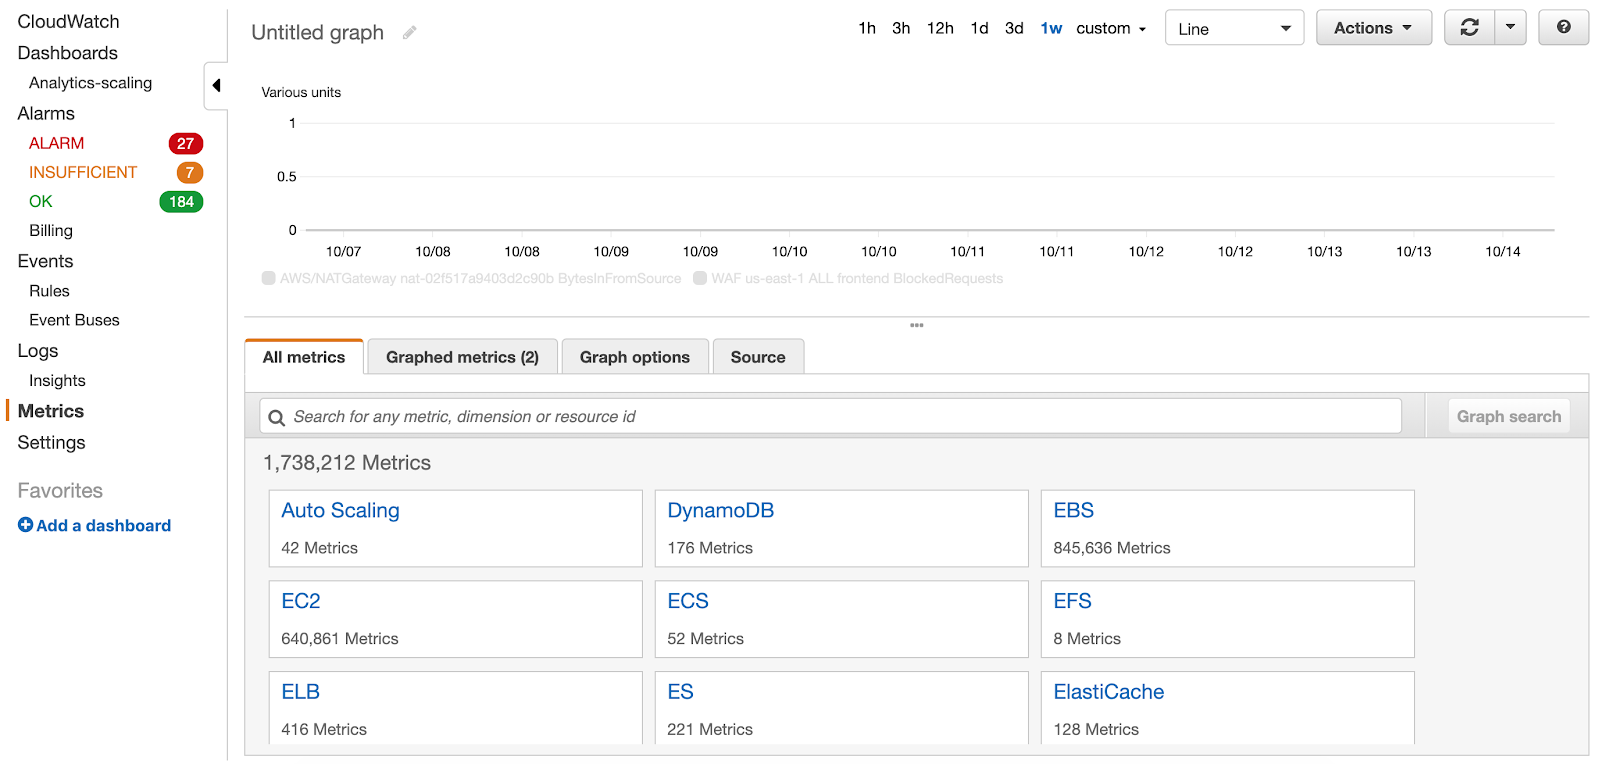
From there, you can focus on a specific metric. In the example below, EC2 instance metrics are the focus.
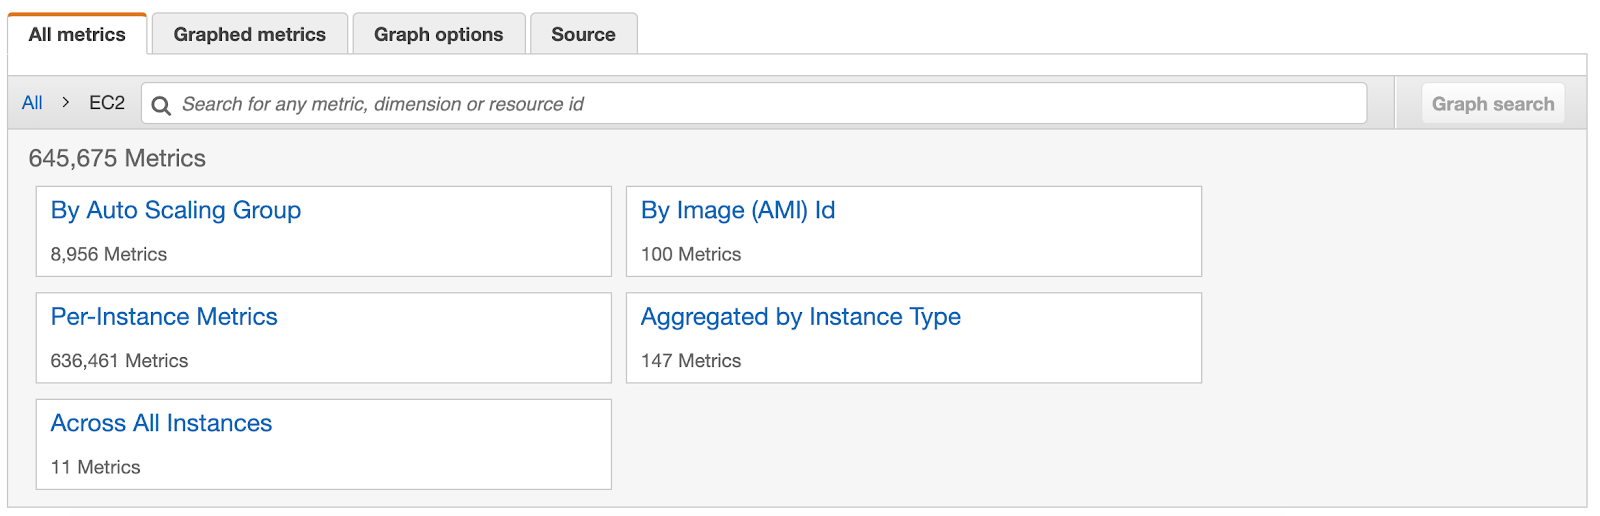
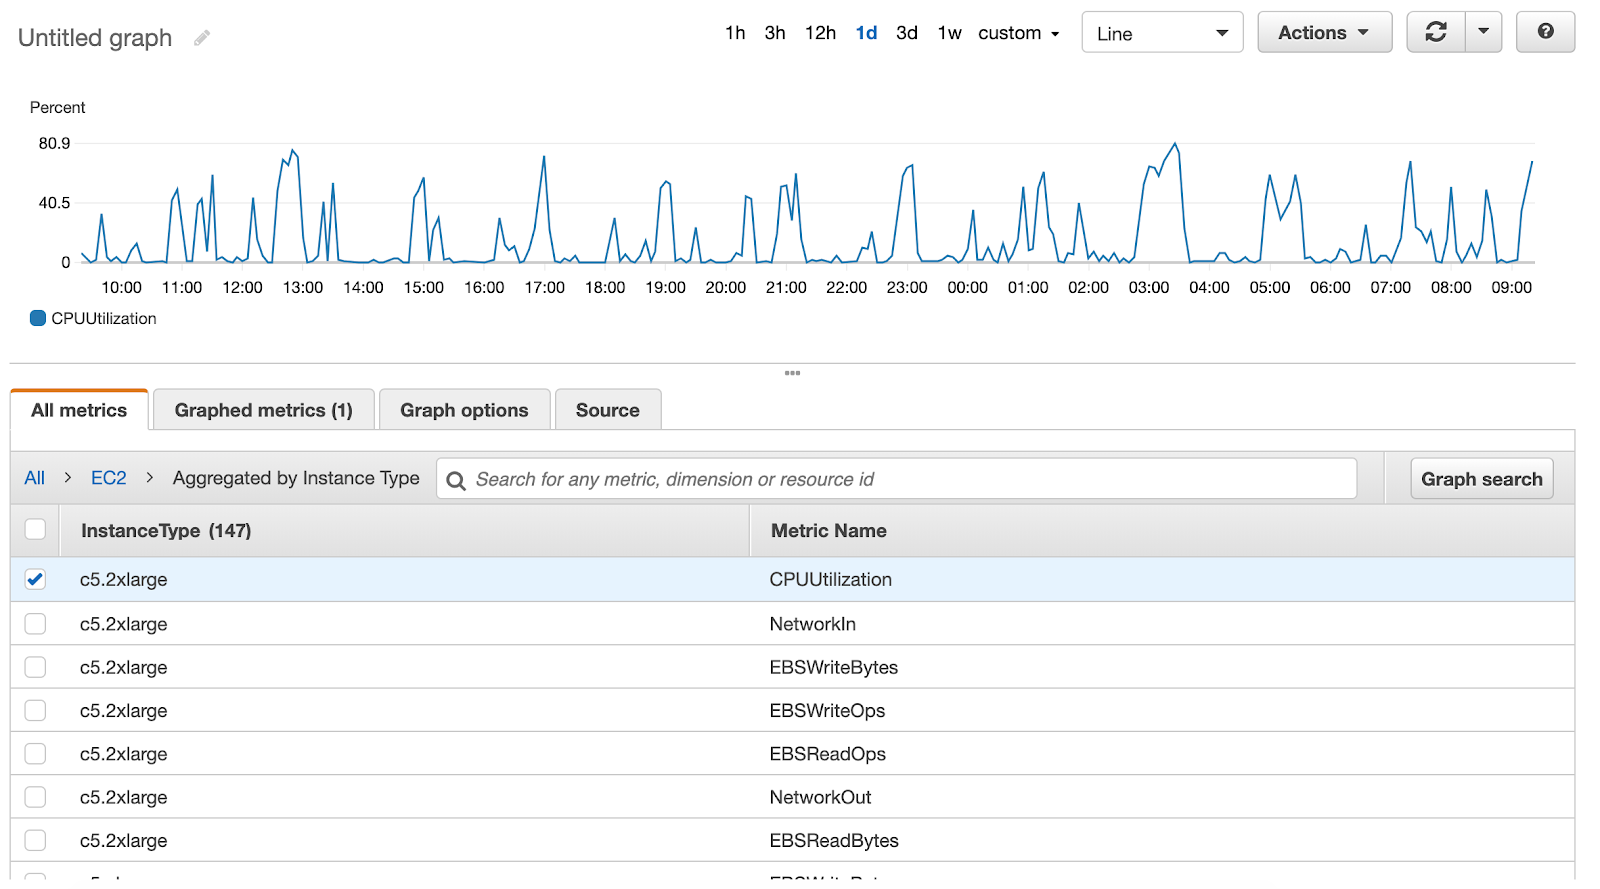
From this point, you can choose a specific dimension to look at. If you click on “Aggregated by Instance Type,” for example, you will see details such as CPU Utilization and EBS Read and Write bytes.
Metrics are a very important component to understand, so make sure to familiarize yourself with the ones that are critical in your cloud environment.
Events
CloudWatch events collects and delivers streams of the various events occurring within your AWS environment. These events show changes of state. You can respond to these changes using custom-made rules which allow you to choose the event source—usually an AWS service such as EC2, CodePipeline, EMR to Route53, or even Trusted Advisor.
After deciding on the source from which you want to gather event data, you need to pick one of the many event types available. For example, if you want to create a rule with an EC2 as a source, you need to set the “EC2 Instance State change Notification,” the “EBS Volume Notification,” and “EC2 Spot Instance Interruption Warning” (which is really useful for those that rely on Spot instances). Of course, you can simply pick all of the event types; however, granular rules will be more efficient than broad ones.
Next, set the target for your rule. The target is used to respond to these changes. A common use case is setting the SNS topic.
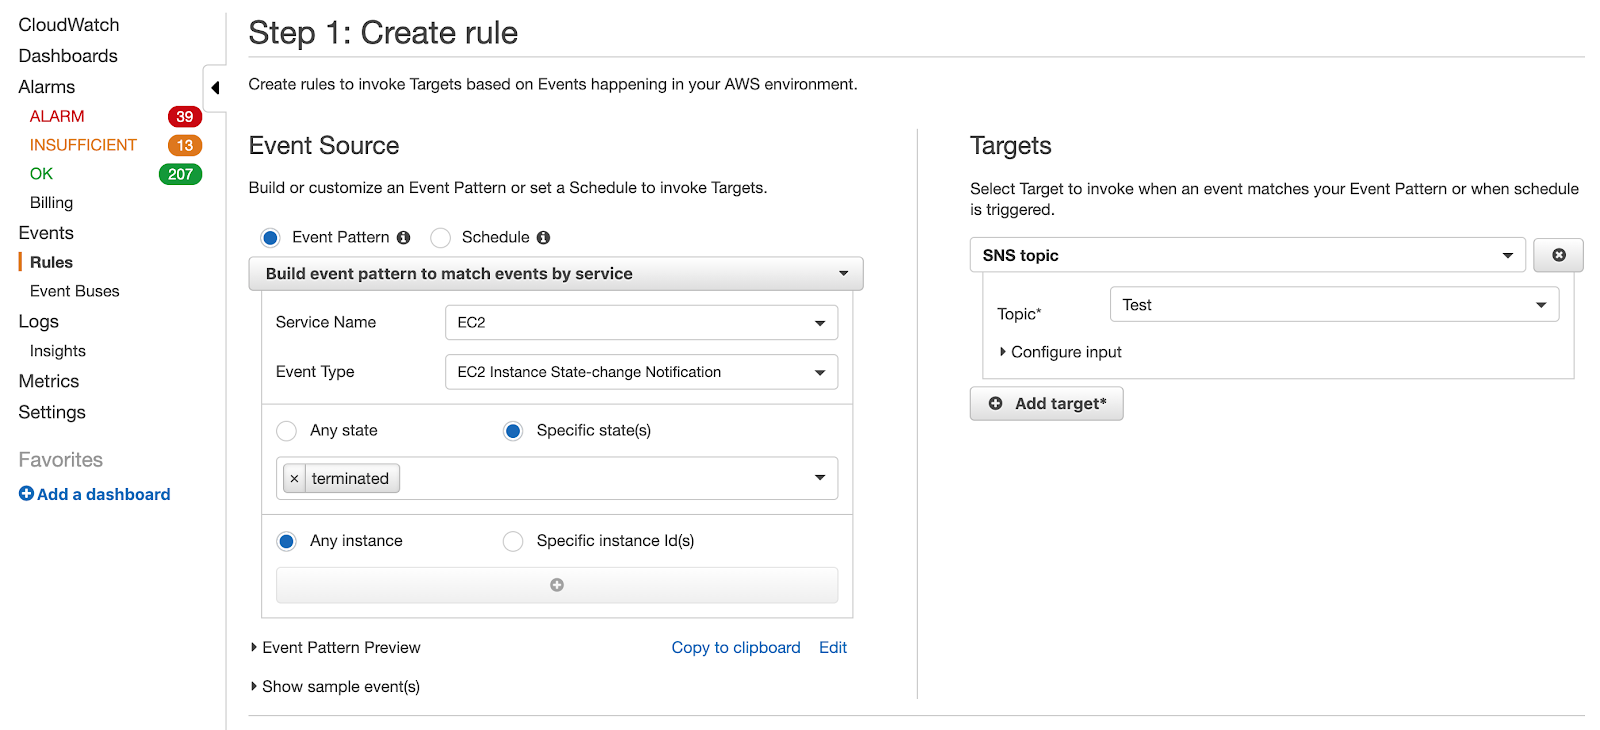
The screenshot above shows you how to receive notifications when any of your EC2 instances have been terminated. You can create a more complex rule with a lambda as a target. The lambda can then create a new instance to replace the terminated one if needed, or it can simply start the next process in the pipeline.
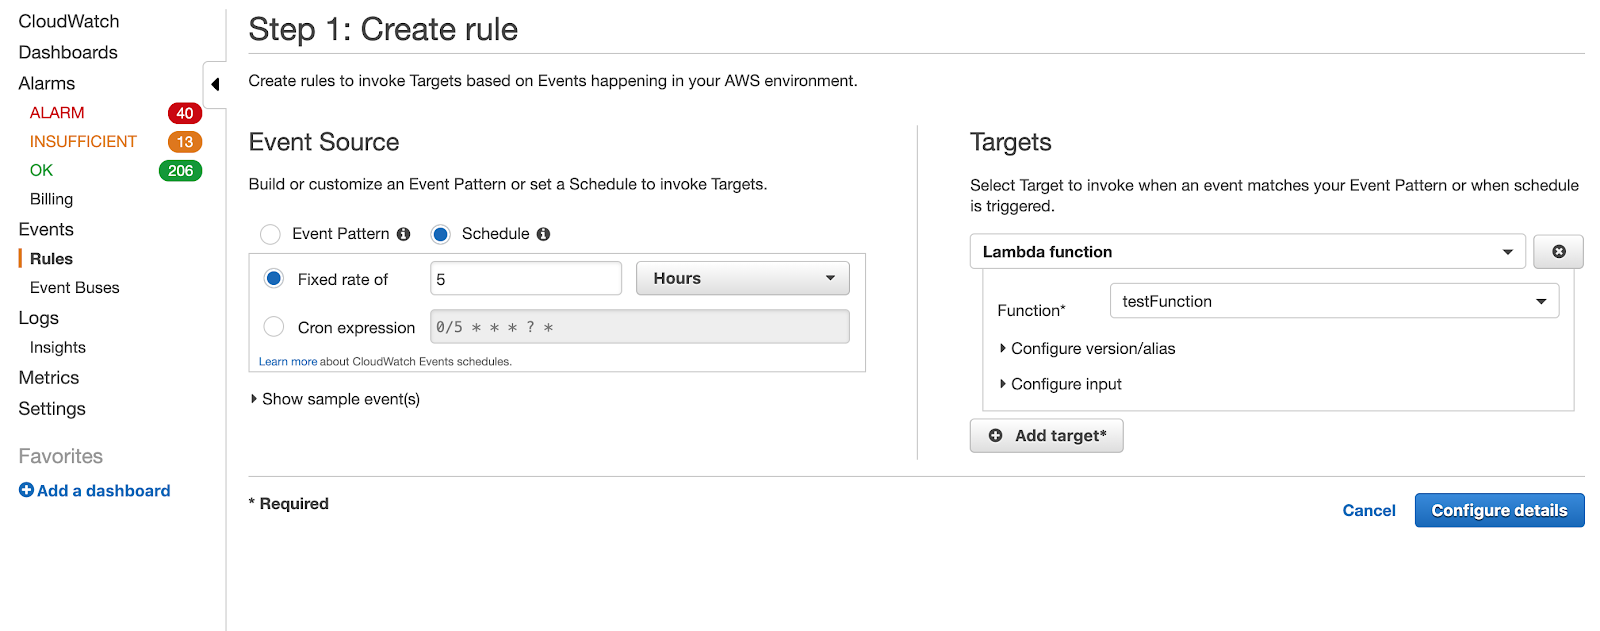
Rules can also be used to create schedules. For example, you can have your custom lambda run every five hours.
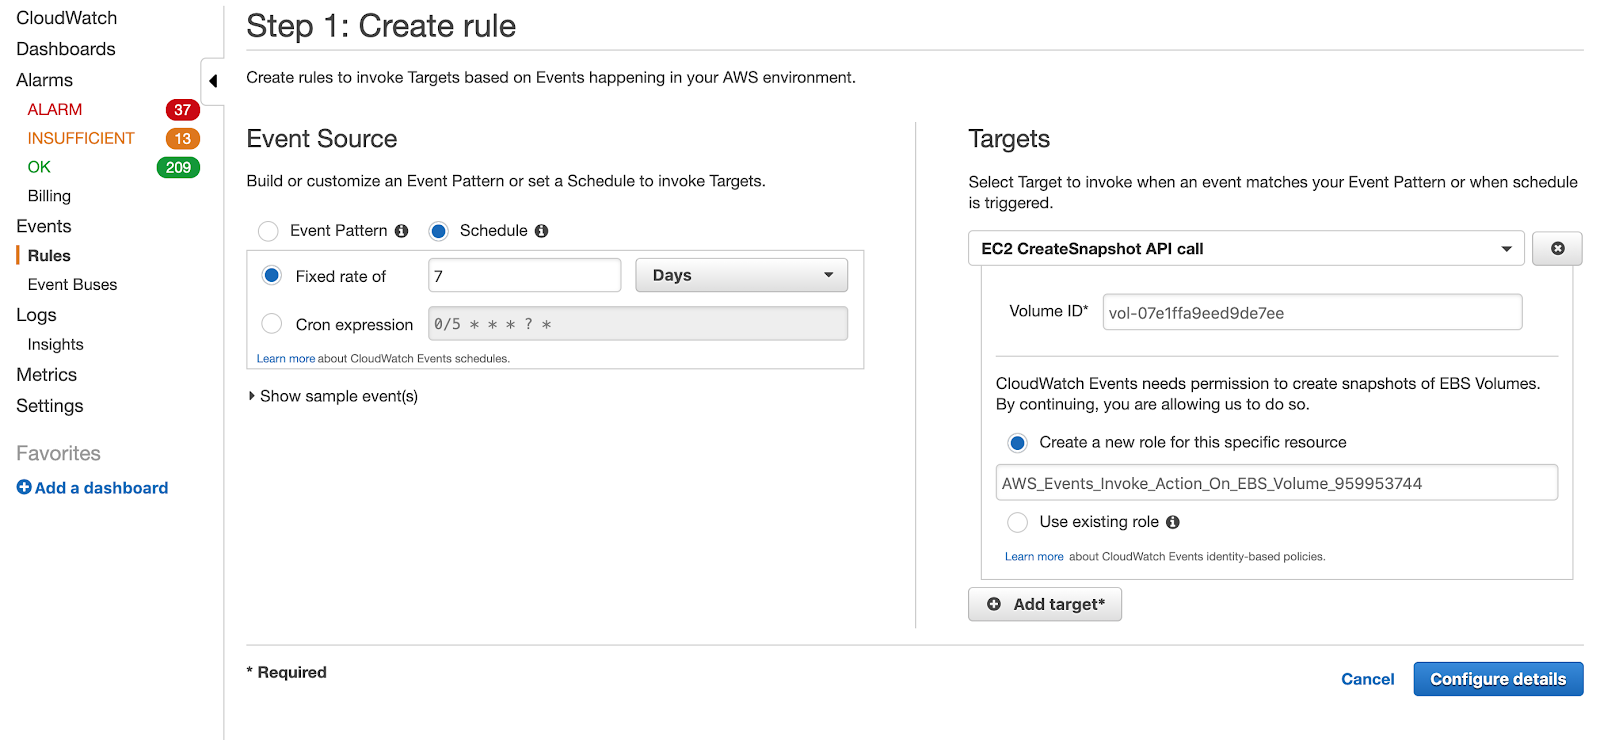
A more common use case involves scheduling backups of your critical EBS volumes. To do this, simply create a desired schedule, and, as a target, select the “EC2 Create Snapshot API call.” Input the “Volume ID” (make sure you input this information correctly), and make sure that you have the necessary role created, since CloudWatch needs permissions to create EBS snapshots for you. Alternately, you can leave it to CloudWatch to create roles for you.
If you are more familiar with Cron style expressions, you can use them to put more detailed schedules in place.
CloudWatch Alarms
CloudWatch alarms are used to watch over a single metric (or a math expression result). They will take action if their value goes above a preset threshold over a desired time period. These actions are only invoked by the alarm when a state changes, which is to say, when the alarm goes from green “OK” to red “ALARM.” This makes them useful for things like sending simple SNS notifications like the ones that can be produced by events. You can also take more specific actions, such as EC2 or AutoScaling Group actions.
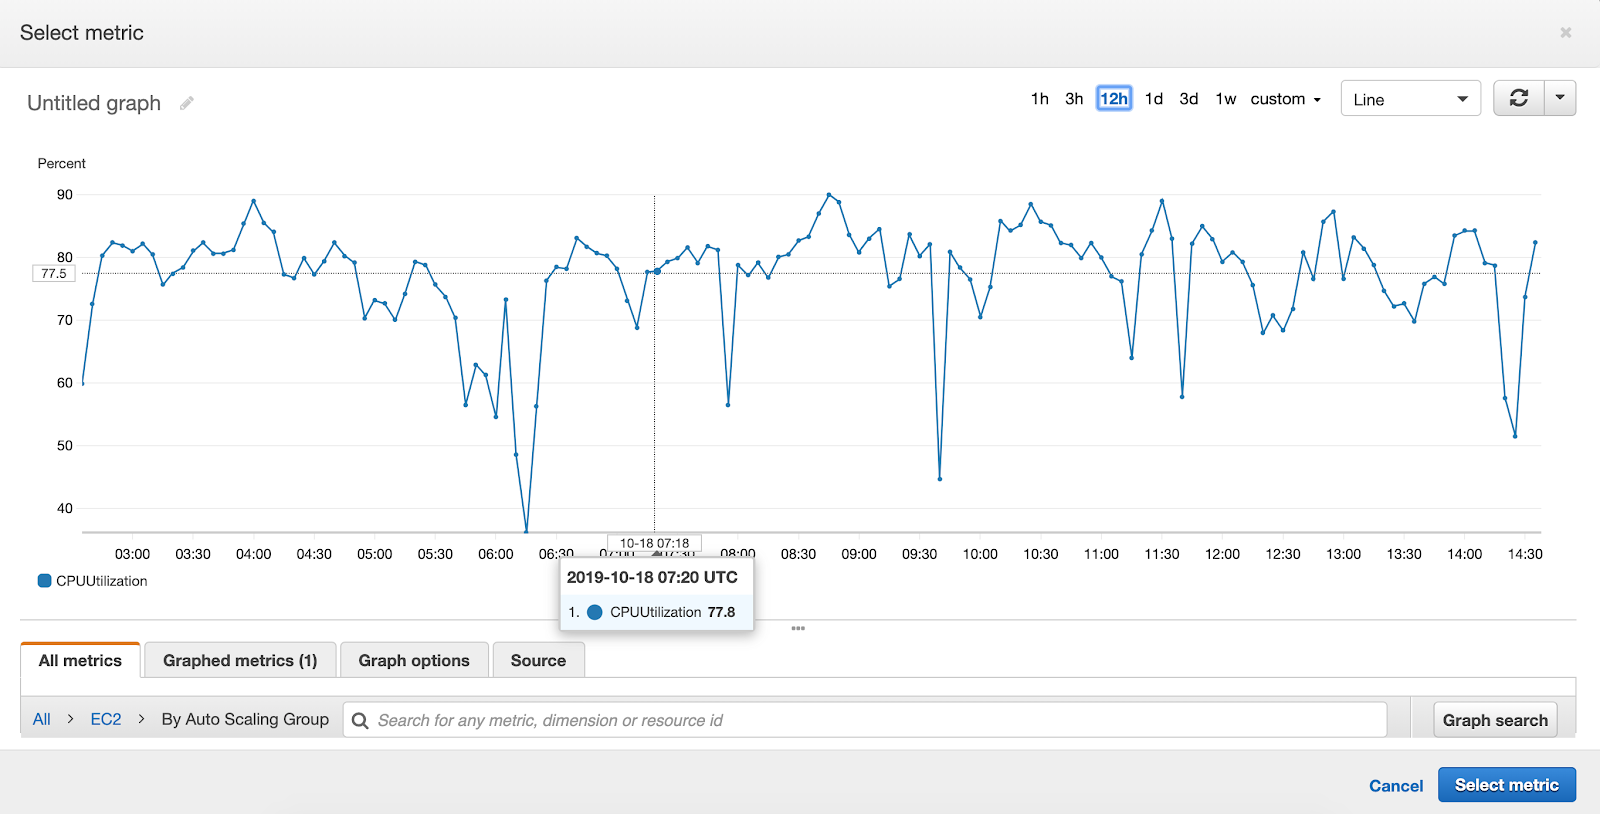
To create an alarm, open the Alarms section in the CloudWatch dashboard. Here, you will first pick a desired metric to be monitored. If, for example, you want to create an alarm that will trigger an AutoScaling Group action, you can choose a commonly used CPU Utilization metric.
Then, create an alarm using that metric.
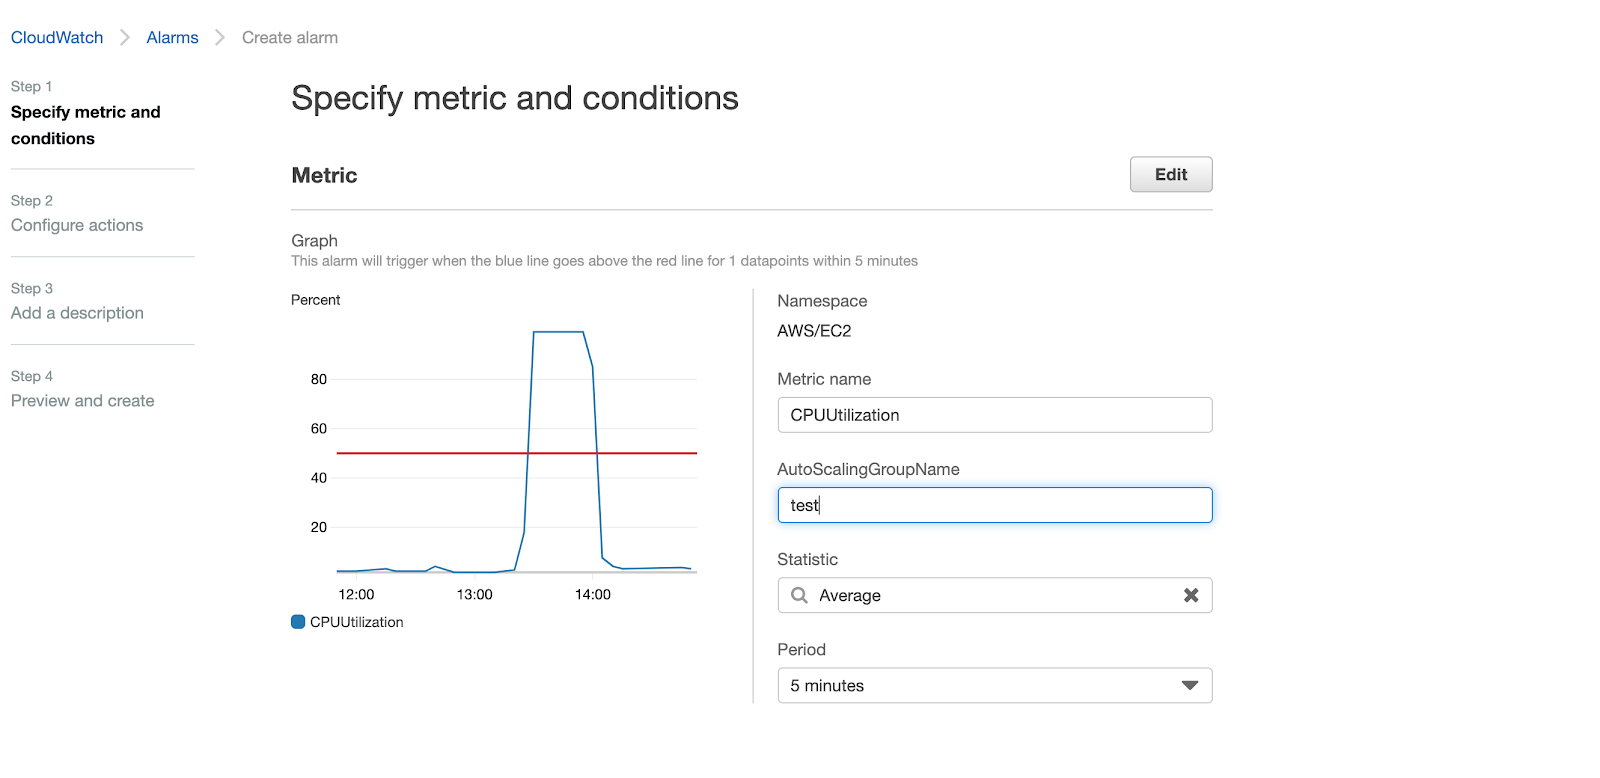
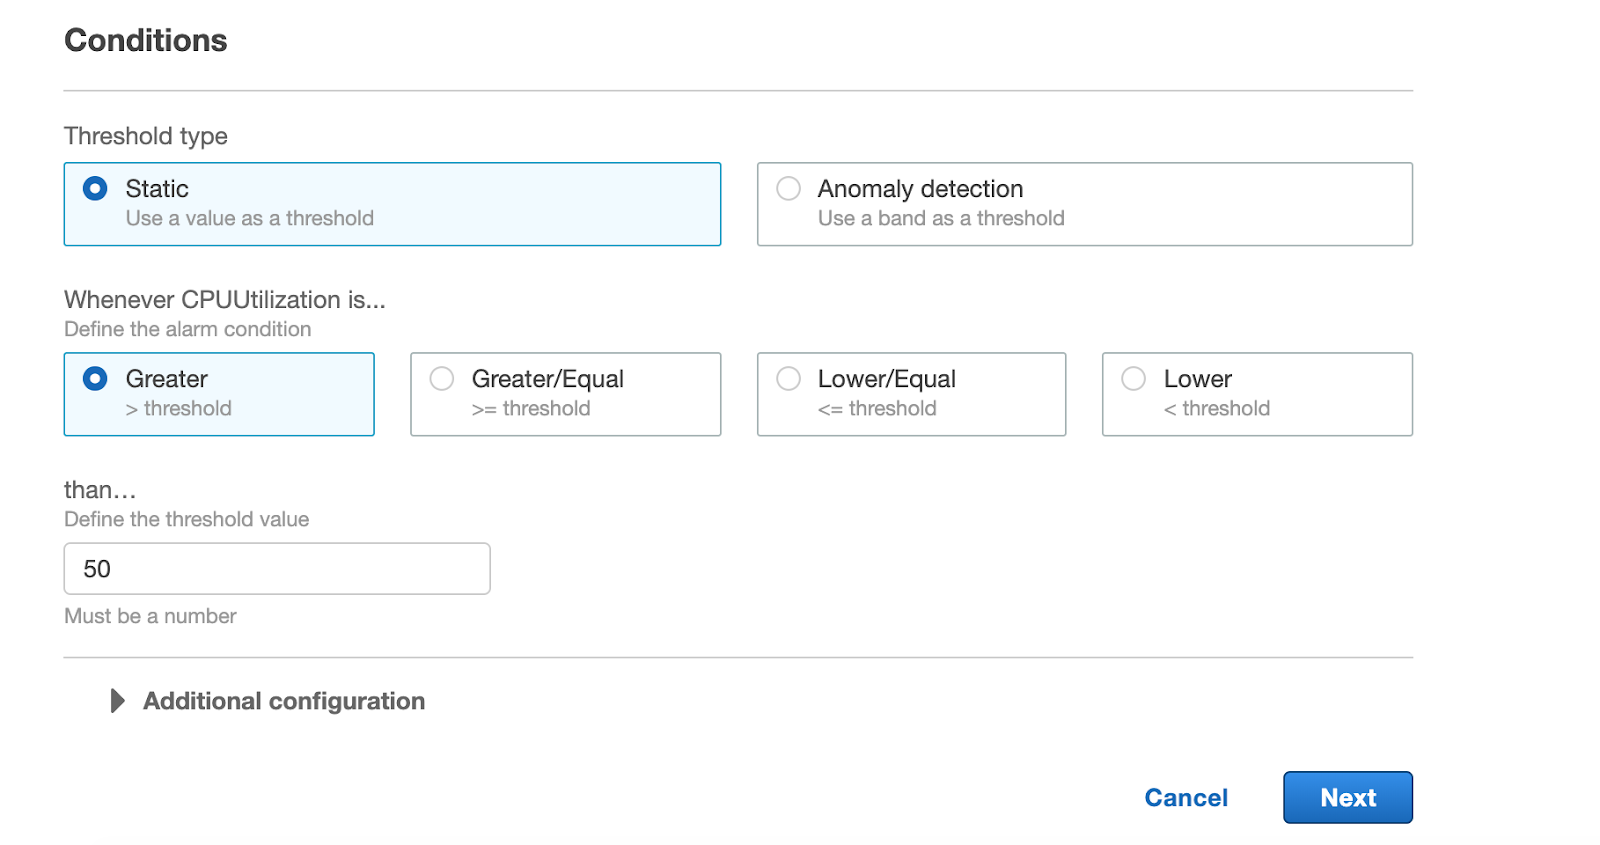
There are settings that can be configured granularly. “Statistics” (choosing from Average, Minimum, Maximum, Sum, etc.) is one of these. “Period” defines how long the metric can breach the threshold before the state changes from OK to ALARM.
There are also conditions that have to be set. Usually, they are static values. In the example below, the condition established is when a CPU Utilization metric is greater than 50 (measured by percentage).
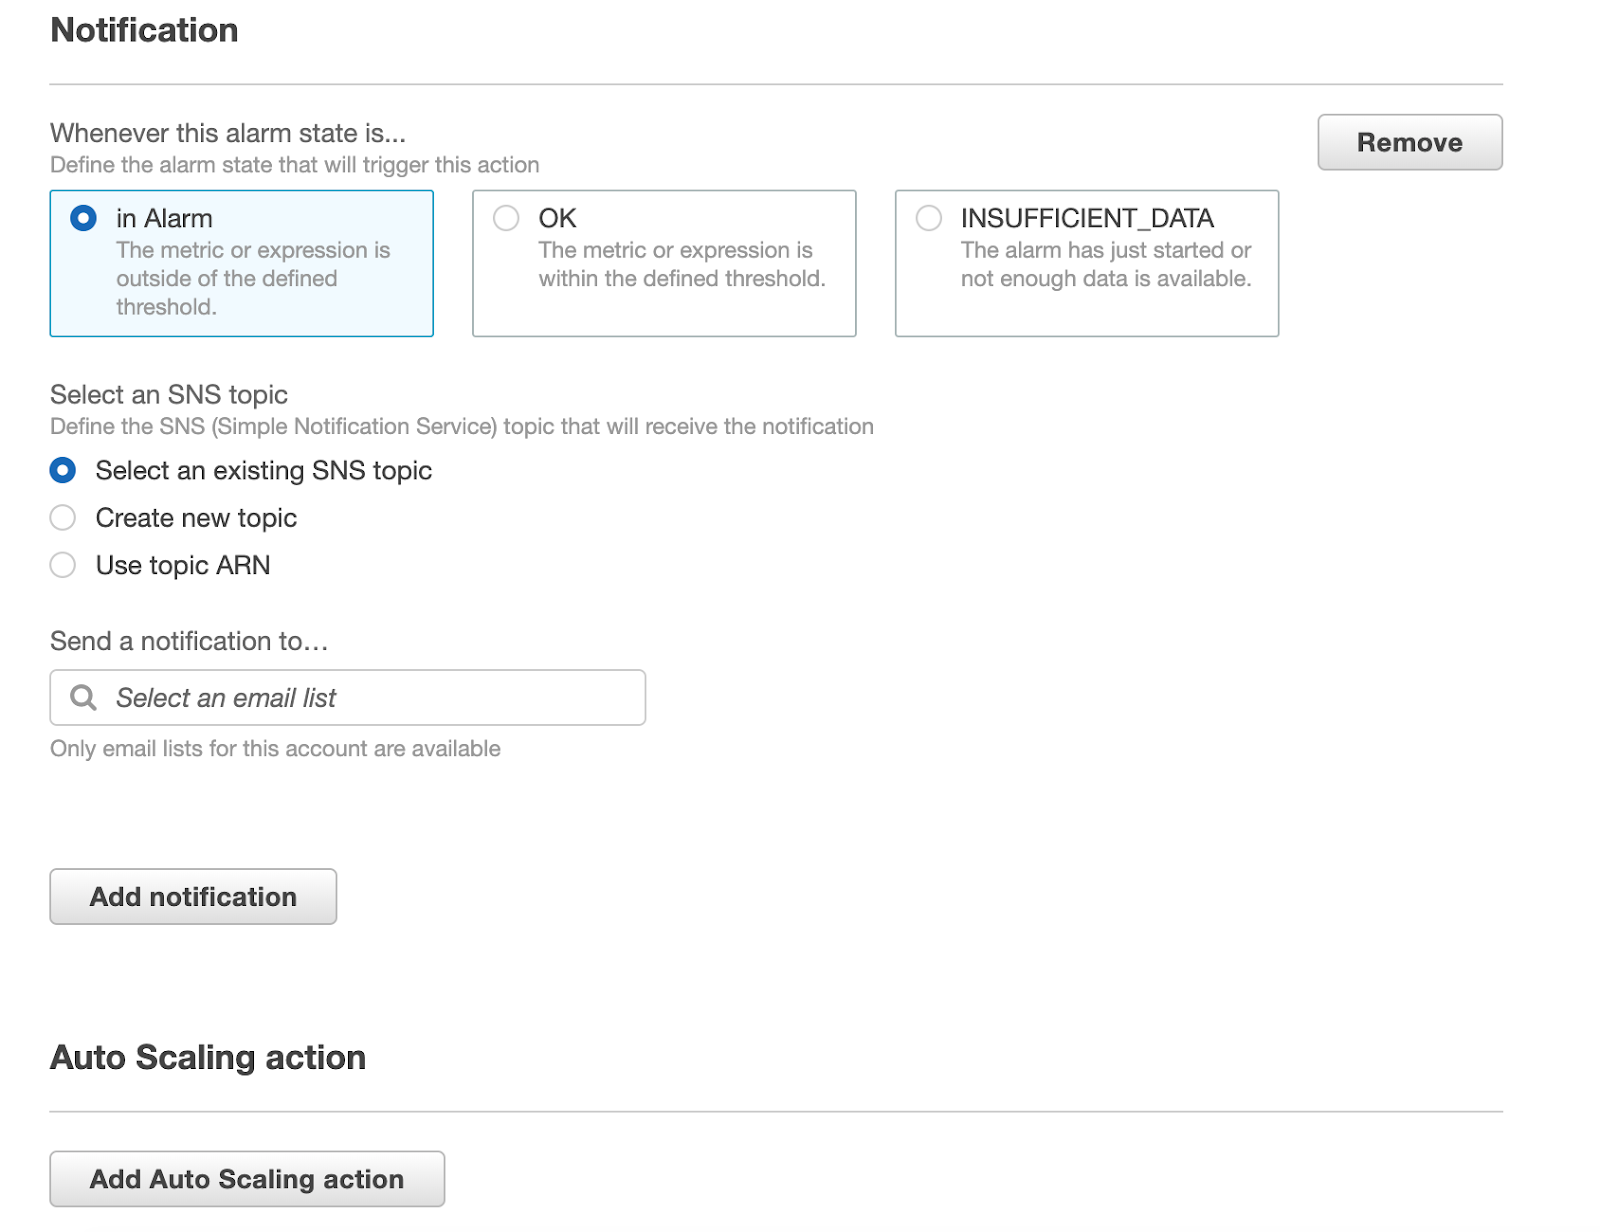
You can also configure notifications if needed; however, on this page, the most important section is the “Auto Scaling Action” at the bottom. Make sure to click on “Add Auto Scaling action.”
You will be taken to a page where you can choose the AutoScaling Group as well as the scaling action to be taken.
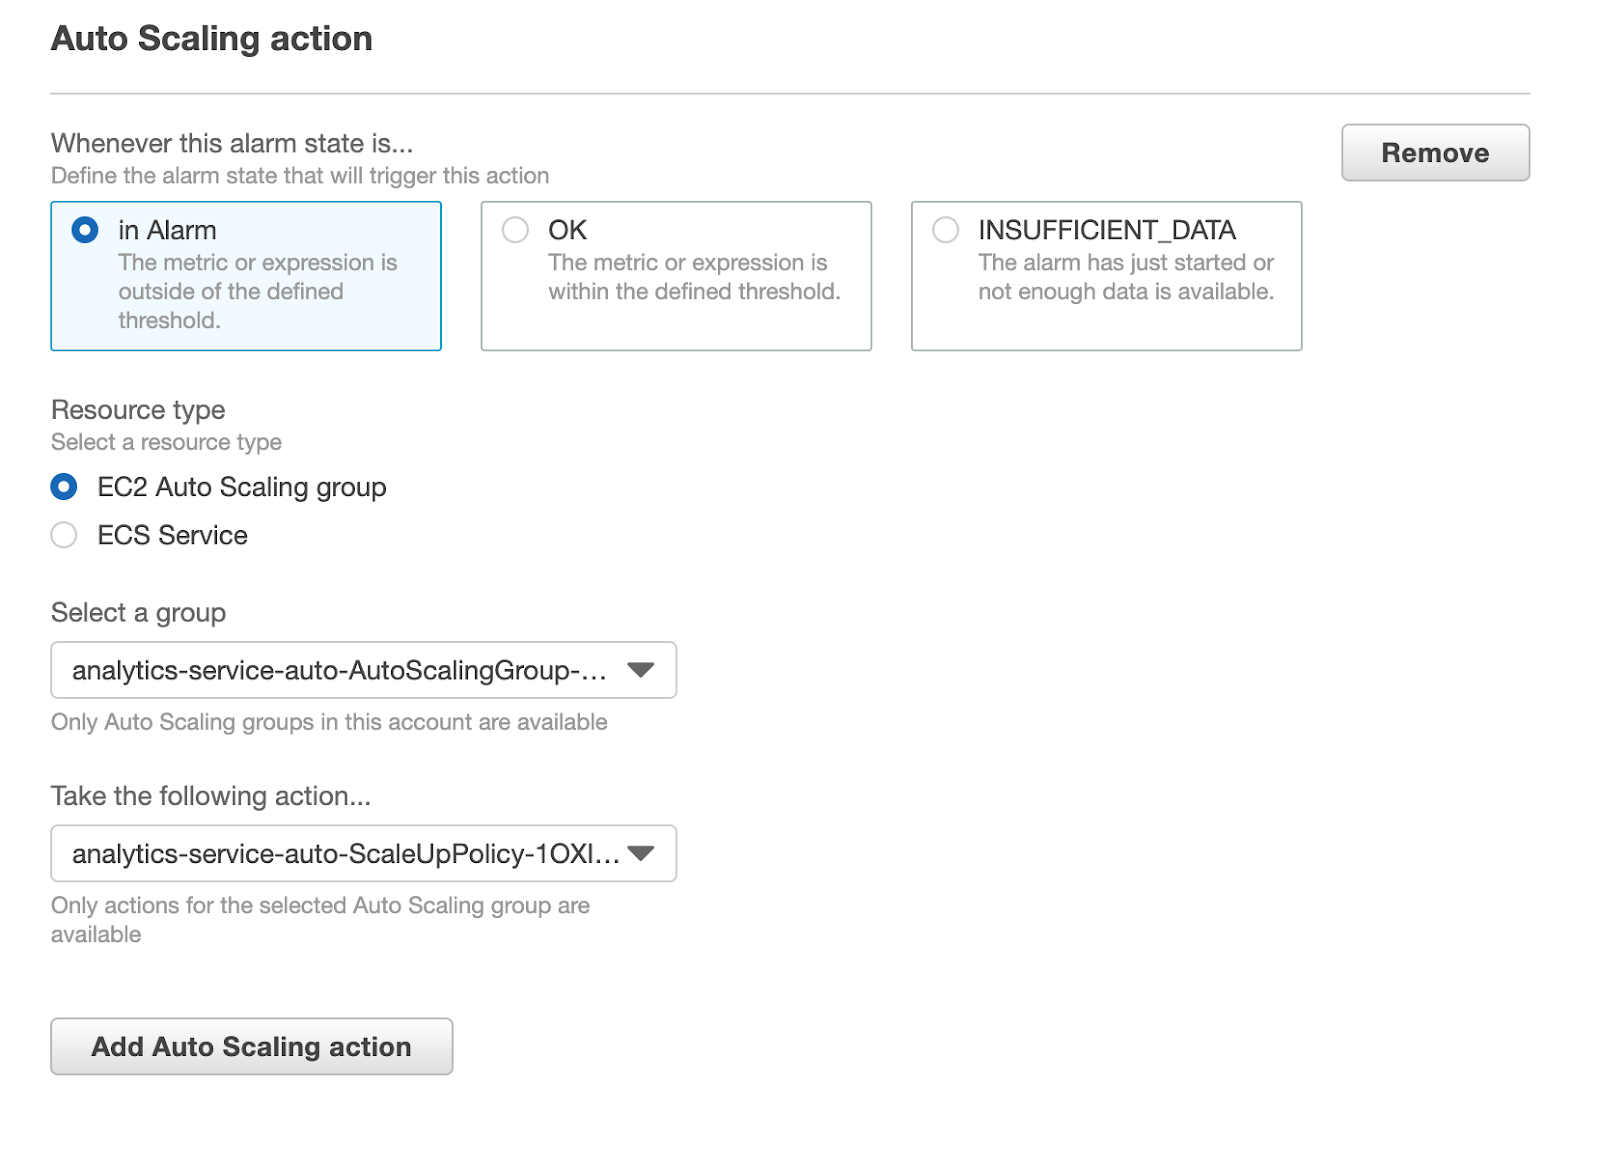
Do note that you can only select actions that are already defined within the AutoScaling Group (actions that are set by the scaling policies). If you don’t have these actions in place already, it is easy enough to create them under “AutoScaling Groups” in the EC2 section of your AWS account.
To create a scaling policy, go to your desired AutoScaling Group, and, under the Scaling Policies tab, add a new policy.
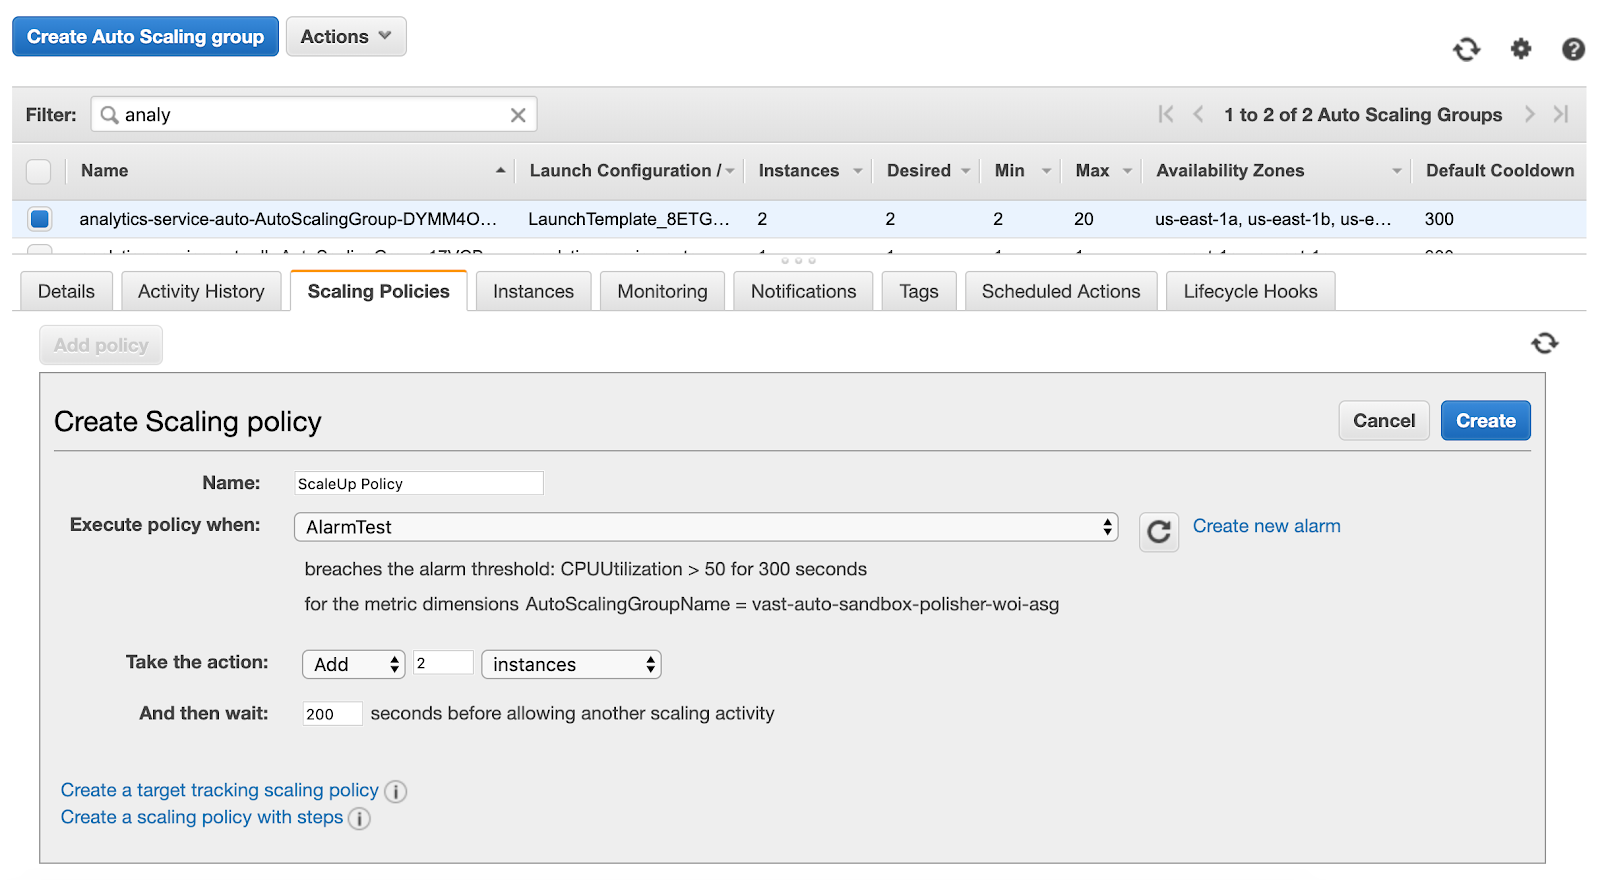
The policy in the example above states that whenever the alarm called “AlarmTest” occurs (which will happen when the CPU Utilization threshold goes over 50% for 300 seconds), the AutoScaling Group adds two more instances to compensate for the lack of resources.
Monitor EBS Volume Performance using CloudWatch
It’s very useful to closely monitor your EBS volume’s performance and be notified of events in time to take appropriate action. With AWS CloudWatch you can easily do this as it provides different EBS performance metrics, including volume read and write operations, volume idle time, average queue length. In this how-to guide, we show you how to set up CloudWatch alarms and receive email notifications if EBS metrics cross a certain threshold value.
All CloudWatch alarms can be added to CloudWatch dashboards for visual monitoring.
CloudWatch Logs
CloudWatch logs are used to store and monitor the logs coming from various applications and AWS services. With CloudWatch logs, all information is centralized and easily searchable. You can also use filters to parse the specific data you are looking for.
For example, you might want to look at the logs for a specific lambda.
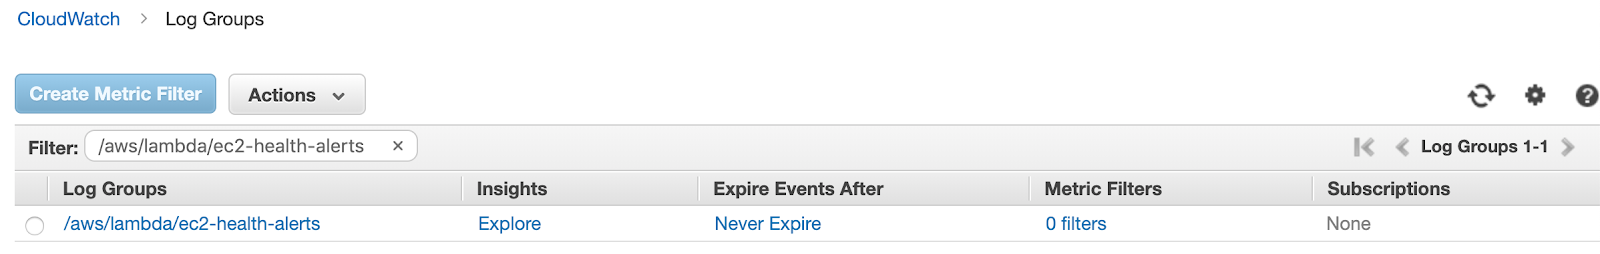
By looking at the “Log Group,” you can get information on all of the log streams.
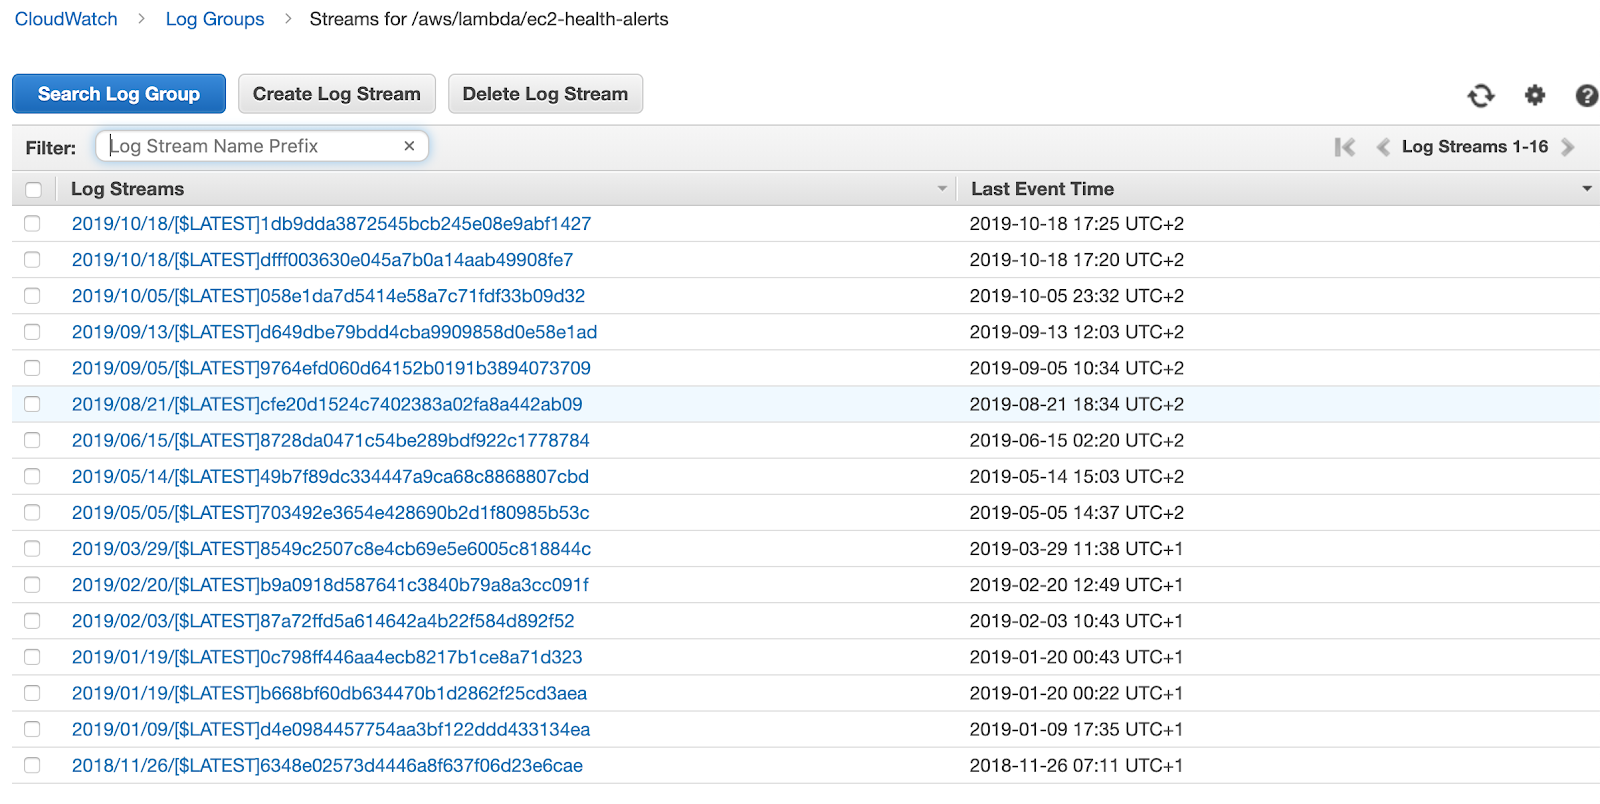
Each stream contains logs that you can look at.
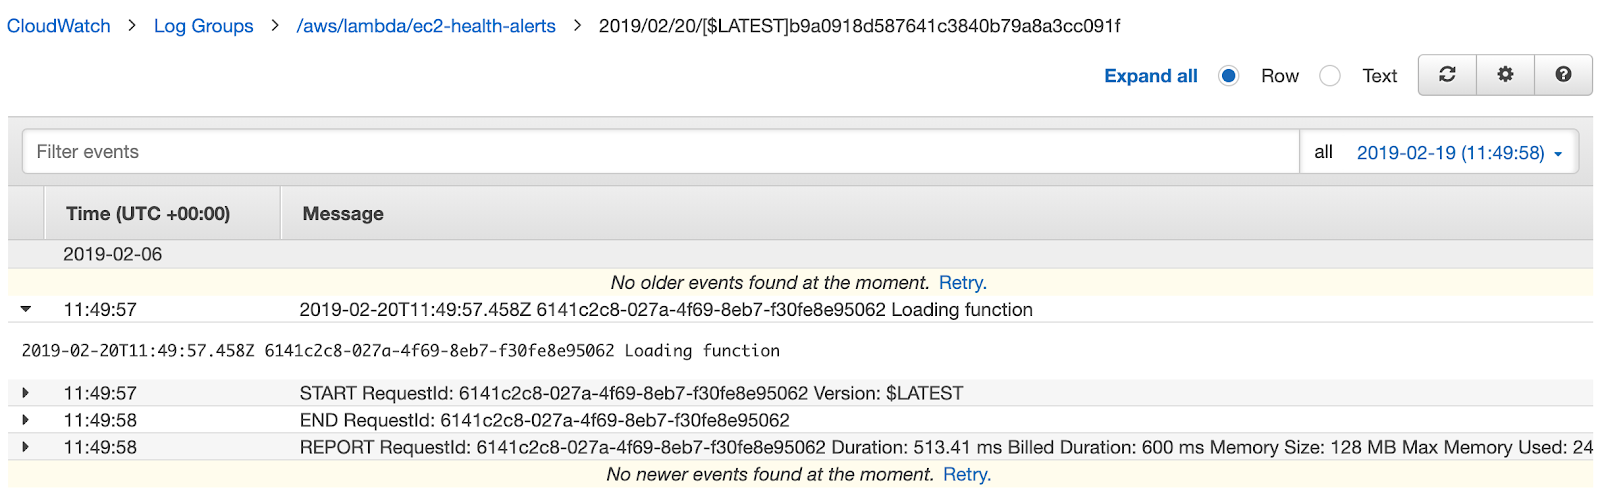
CloudWatch Logs allows you to monitor CloudTrail events, logs from EC2 instances, and Route53 queries, among other data. Logs are kept indefinitely unless you set up a log retention value. These can vary from one day to ten years.
CloudWatch Dashboards
CloudWatch Dashboards allow you to create customizable pages that enable you to monitor various AWS resources in one place. You can monitor both metrics and alarms and span multiple AWS Regions, giving you a wider picture of your AWS environment.
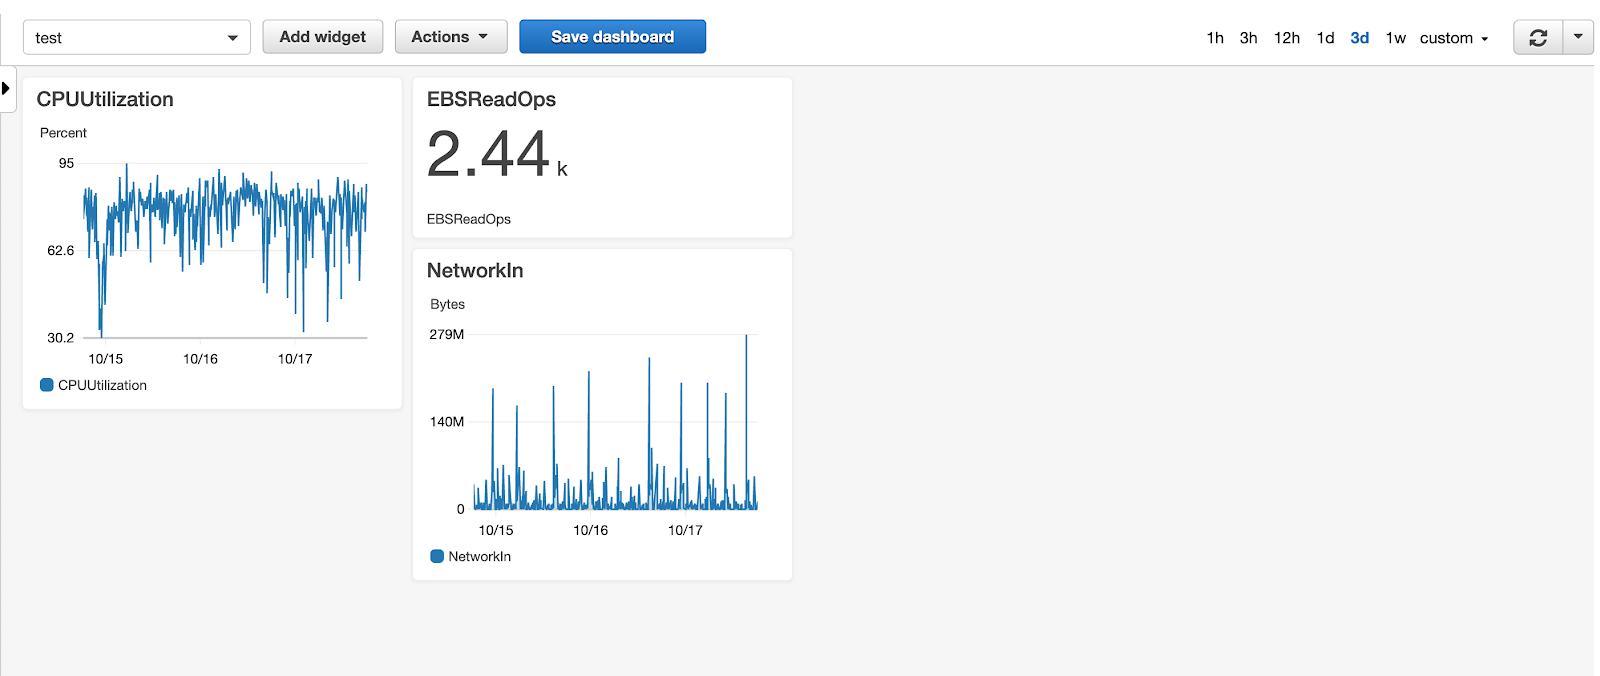
To create your own dashboard, open the Dashboards section in CloudWatch. Name your dashboard, then add a widget (line, text, etc).
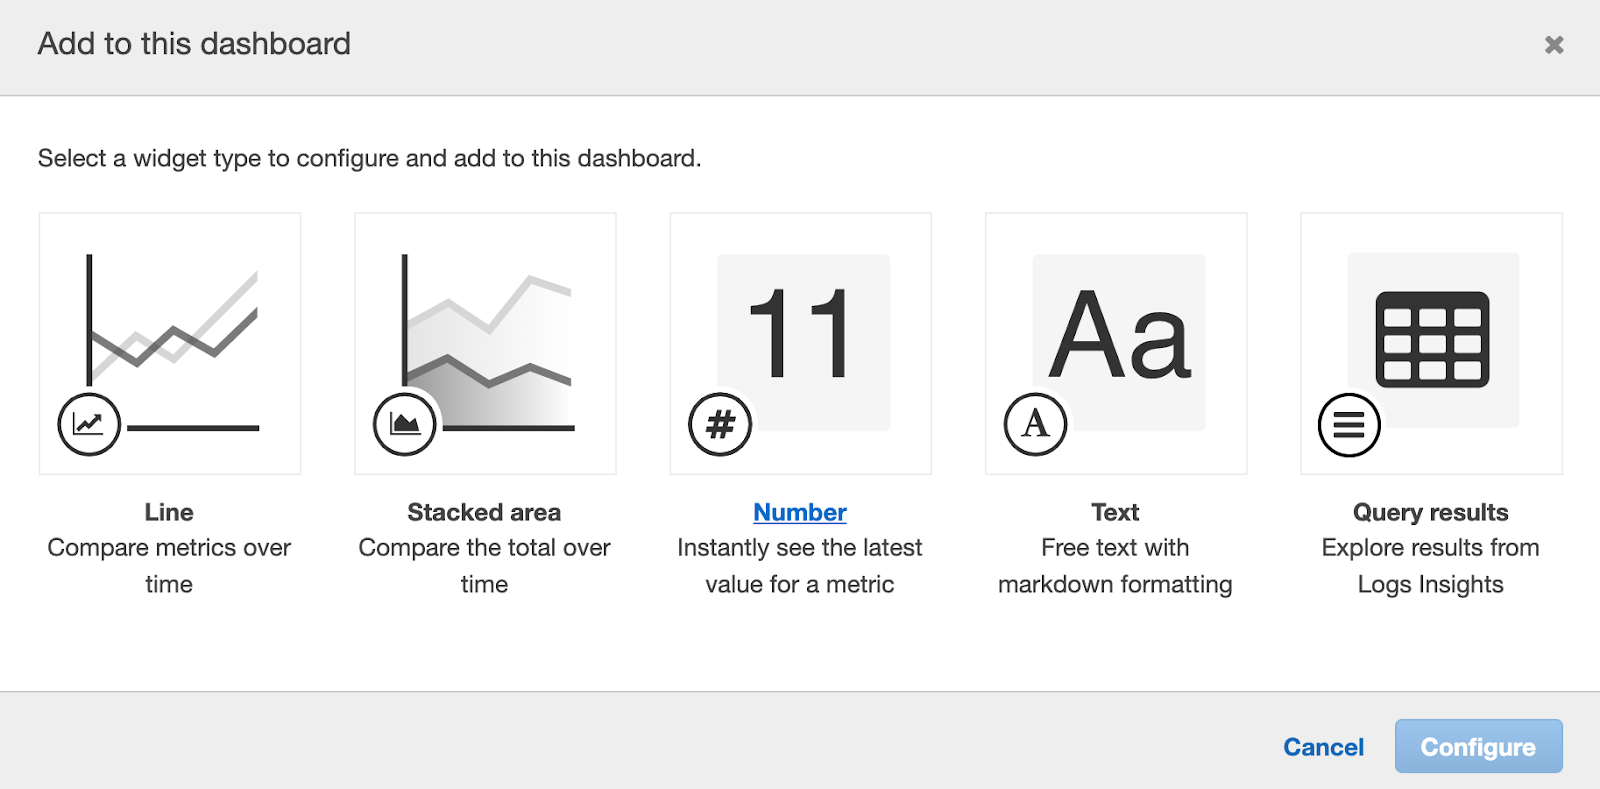
If you choose a line widget, you will need to select a metric to be added to your dashboard.
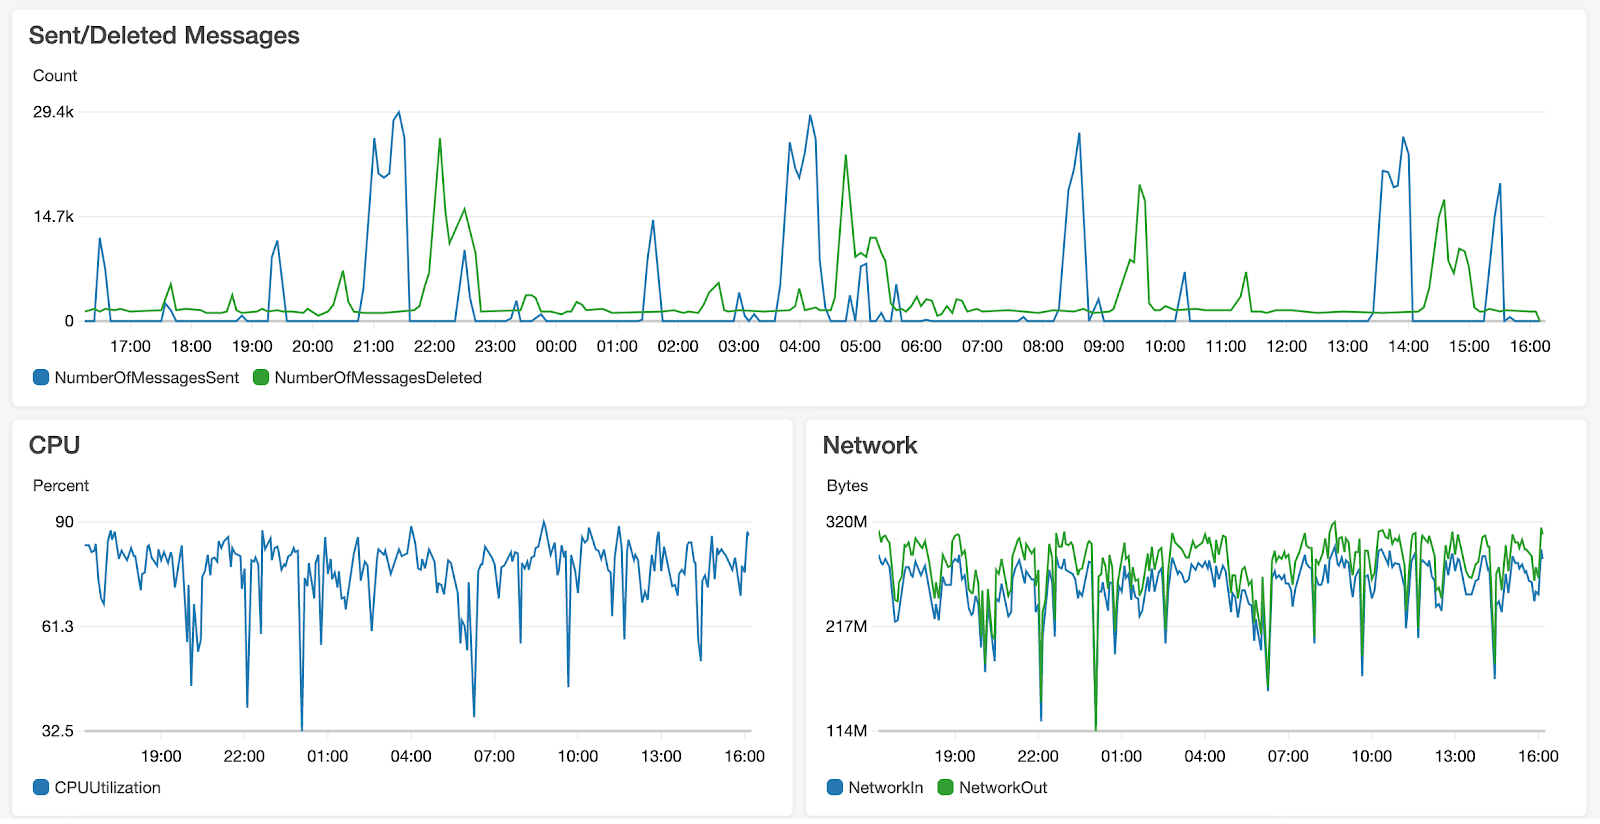
You can then proceed to add as many widgets as you want, customizing the dashboard to your liking.
There really is no reason not to use Cloudwatch
In this post we took a deep dive in how to get the most out of CloudWatch. We examined CloudWatch components and offered some possible use cases and with so many sister services each with their own distinct benefits, there really is no reason not to use this valuable AWS service. With the exception of alerts not being entirely intuitive, once you get past the trial and error stage it will be an integral part of the environment for those working with AWS. It’s also fairly cheap and 3rd party tools can be augmented. We do recommend investing some time into understanding how it works in order to reap maximum benefits from it.