
A Continued Look at AWS Cost Explorer:
EBS Snapshots, Tagging, API and Reserved Instance Purchase Recommendations
In part one of this series, we looked at the benefits of using AWS Cost Explorer to gain greater insight into your AWS costs. We discussed how you can observe your costs over time and how to use the forecasting capabilities to predict future spending with confidence. In this final part of the series, we will continue with our overview and we will also focus on some of the recent updates that were introduced, such as the redesigned interface for easier use, cost allocation for EBS snapshots which greatly improves cost management capabilities with AWS, the new Interactive Cost Explorer API which allows you to programmatically retrieve cost and usage data and finally, the new Reserved Instance purchase recommendations which help further identify opportunities for cost savings.
Overview of Cost Explorer Features Continued
The latest update to Cost Explorer brought the redesigned user interface that improves many common workflows, such as filtering and the grouping of data. Filtering is a major feature of Cost Explorer, as it lets you isolate the exact data you want by parsing just what you need from the vast amount of information presented. You can narrow down your choice and filter by service (focusing only on EC2 instances or S3, for example), instance type (looking only at t2.micro or m4.xlarge), or even API operation (looking only at CreateSnapshot of GetObject API calls). For an even more fine-grained view, you can apply multiple filters, and only the intersecting data will be shown.
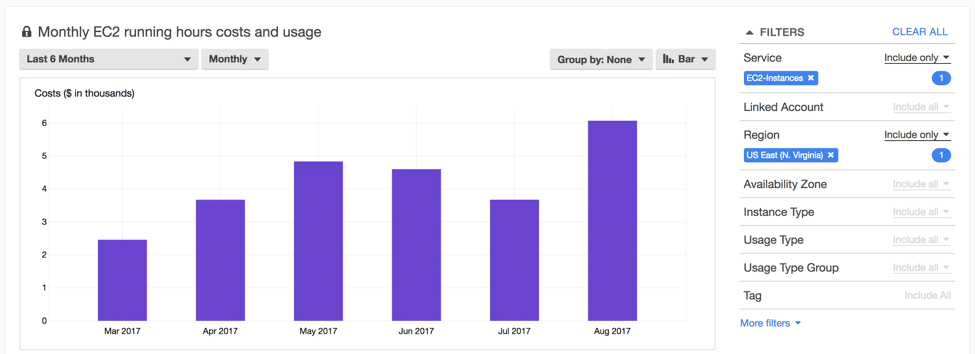
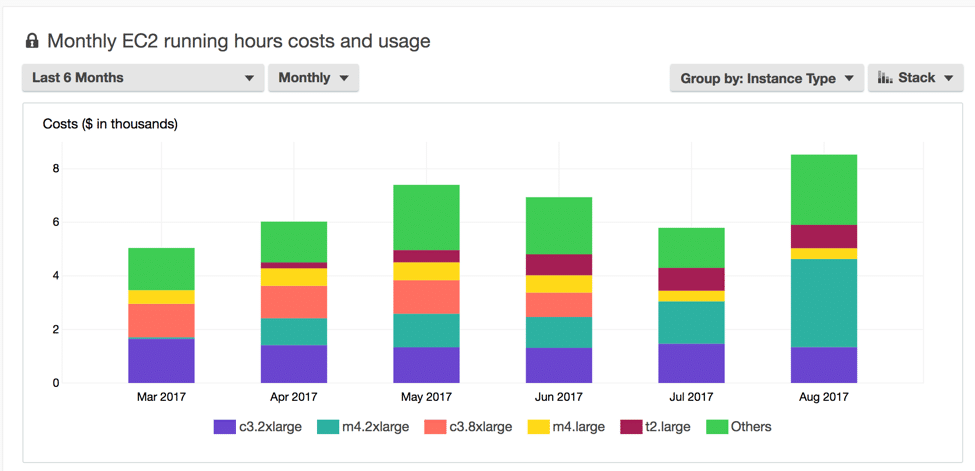
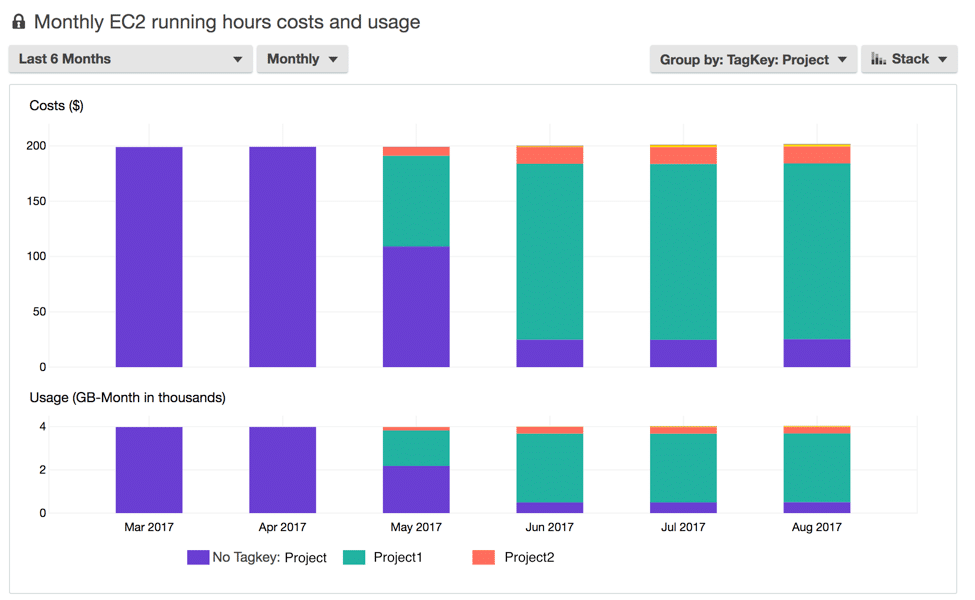
Another feature of Cost Explorer is the “Group By” option, which lets you display data grouped by the same previously mentioned filters. If you are filtering data by EC2 instance, you can, for example, use this option to group by region. The result will be a chart that shows separate EC2 data for each region being used. On the other hand, if you choose to group by usage type, you can expect to see all EC2 instance types that you used during the selected time period, along with the costs they produced.
Cost Allocation for EBS Snapshots
Calculating the cost of your EBS snapshots used to be little more than a rough estimation, while methods that were slightly more accurate required tool installation (such as Performance Monitor for Windows or an open source tool iotop for Linux) and looking at patterns over time. This process was complex, but necessary, as EBS snapshots are a crucial part of any Disaster Recovery strategy and their cost must be taken into consideration. In May of this year, AWS announced that they would be updating their EBS service to support cost allocation tags for EBS snapshots.
This new feature allows you to expose your EBS snapshots using tags and then view the data using the Cost Explorer or Reports. Snapshot forecasting is a major update that makes it easier than ever to understand and manage your spending with AWS. This is especially useful for N2WS Backup & Recovery customers, because N2WS automates backup and recovery in AWS using snapshots. You now have a clear view into the cost of N2WS-created snapshots, which lets you adjust your backup and DR strategies accordingly. In order to fully utilize this new feature, there are a few steps you need to take first:
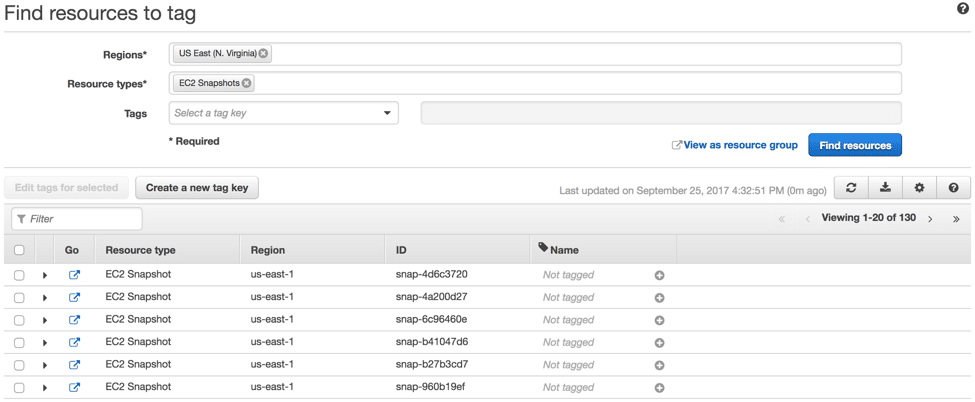
Step 1 – Tagging Snapshots
Before you can see your exposed snapshots, you have to tag them first. You can create tags per project, team, client or anything else. Make sure you have a tagging policy and that each snapshot is tagged properly so that it can be shown in Cost Explorer. Using Tag Editor, find and tag the desired snapshots, or alternatively, you can use AWS CLI or AWS API to add or overwrite tags for specified snapshots.
Using Cost Allocation Tags with N2WS Backup & Recovery
N2WS is an enterprise backup, recovery and disaster recovery solution for Amazon EC2. The solution allows you to automate backups, maintain and recover your entire EC2 (as well as RDS, Amazon Redshift, Amazon DynamoDB & Amazon Aurora) environment as well as achieve application-consistent backups. In addition to the many features N2WS has, it also offers automated backup scheduling using AWS tags. N2WS can scan your AWS resources automatically and schedule them for backup. You can also using N2WS’s tagging feature to identify snapshots that you would like to keep track of in Cost Explorer. This makes it extremely easy to monitor and predict costs for specific departments, for example.
To enable tagging, you must have added tag with key as “cpm backup” and value as your cpm backup policy name. If a policy with the defined name does not exist, N2WS will create the policy. By using N2WS to tag your original volumes, these tags can be copied to the snapshots – allowing you to use the Cost Allocation Tags feature. Alternatively, you can use the”cpm_policy_name” tag that N2WS creates for every snapshot. This will also allow you to see the cost not just by business unit, but by backup type. For example, following these tagging identifiers, you will be able to see backup costs per department, as well as granular visibility including hourly, daily and weekly backups: Tagging Identifiers Using N2WS Backup & Recovery Hourly_Accounting Daily_Accounting Weekly_Accounting Hourly_Financing Daily_Financing Weekly_Financing, etc…
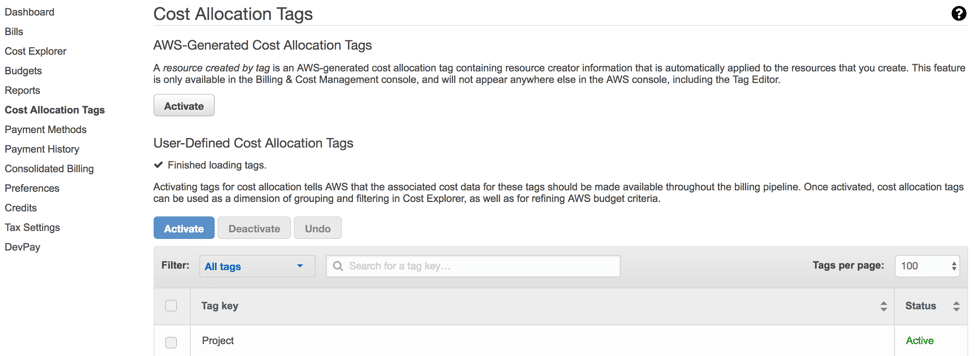
Step 2 – Activating New Tags
All user-defined tags have to be activated before they can appear in Cost Explorer or in the Reports. Under the Billing and Management page, open “Cost Allocation Tags”. Locate your newly created tags on the list and activate them.
Step 3 – Viewing Snapshot Data in Cost Explorer
Open up Cost Explorer and filter your data using “Usage Type Group” and then select “EC2: EBS – Snapshots”. Then set the “Group By” option to tag and select the tag that you have previously created and activated. You now have a very detailed overview of your EBS snapshot costs.
Interactive Cost Explorer API
Since there are many companies that are moving large amounts of raw data into the AWS Cloud, there had been a gap that needed to be filled because customers were still extracting data because they could not programmatically explore their costs and usage within Cost Explorer. In November 2017, Amazon introduced Interactive Cost Explorer API. Now a user can retrieve cost and usage metrics and summarize this data by various dimensions (Service, Availability Zone, Account, etc.), and on top of that aggregate the data for a specific time period.
Access to Interactive Cost Explorer gives the user much more control over how they can drill down their data. By having this kind of transparency, you will be able to see your infrastructure expenses for specific tagged events or marketing campaigns, for usage of a DynamoDB database table in your production environment, for example, or drill down to see overall monthly costs and even daily usage. There are a few things to keep in mind when using Interactive Cost Explorer API. API’s give you two levels of grouping while the Cost Explorer web application provides one level. This will give you the ability to group costs, for example, by an Availability Zone and then by Service. Also, each API call costs $0.01 which is still far less expensive than extracting and grouping the data within your own system.
Reserved Instance Purchase Recommendations
Back in December of 2016, Amazon announced that Reserved Instance (RI) Utilization Reports will be added to Cost Explorer in order to help the user better understand their costs and usage. Through these reports, the user will now better understand their utilization, instance type, purchasing account and other reserve-related information within a specified time period. In addition, the user can define a threshold and identify specific reserve instances that have maxed out those limits.
Amazon made another announcement in November 2017 detailing another means to help you understand and optimize your usage of EC2. By retrieving information from Cost Explorer, Reserved instance purchase recommendations can now be accessed. Cost Explorer can even identify instance family usage that can be optimized with your reserve instances. The parameters can be managed and revised according to an organization’s needs (for specific time periods for example). Once a user understands how to properly optimize their Amazon EC2 RI’s, they can purchase them directly through the link in Cost Explorer.
Summary
AWS Cost Explorer allows for a precise view of your spending, using filters and charts to parse and present data. It’s cost prediction capabilities using forecasting and confidence give you a reliable method of determining your potential spending in the near future. Thanks to the powerful new option to track EBS snapshots using tags, if you use N2WS, you can get a more comprehensive view of your snapshot costs, while keeping your data safe. And with improvements to the interface, as well as all the new features that are continually being pushed out in order to help organizations optimize their usage and spending, this free tool is essential for anyone using AWS. Catch up on Part I of our AWS Cost Explorer analysis here.