N2WS Backup & Recovery is a reliable solution for protecting multiple servers across multiple accounts in various organizations. However, because it lives as an EC2 instance in your environment, it may encounter issues, like any EC2 instance, that can affect its performance and functionality. For example, the disk may become completely full or the EC2 status check may fail.
Fortunately, these issues can be easily prevented and resolved. In this guide, we’ll walk through how to install the AWS CloudWatch agent to monitor disk space and how to configure alarms to notify you about disk space issues or EC2 status checks.
First, let’s setup an alarm on your N2WS instance to alert you in the event of an EC2 Status check failure. Then we’ll install the CloudWatch agent and enable an alarm to monitor disk space usage.
1. Set up an EC2 status check alarm
Occasionally, the N2WS instance may encounter an issue that causes its status check to fail. Although these AWS issues are rare, it’s advisable to set up an alarm in case they occur.

NOTE: The steps in this part are based on this AWS documentation.
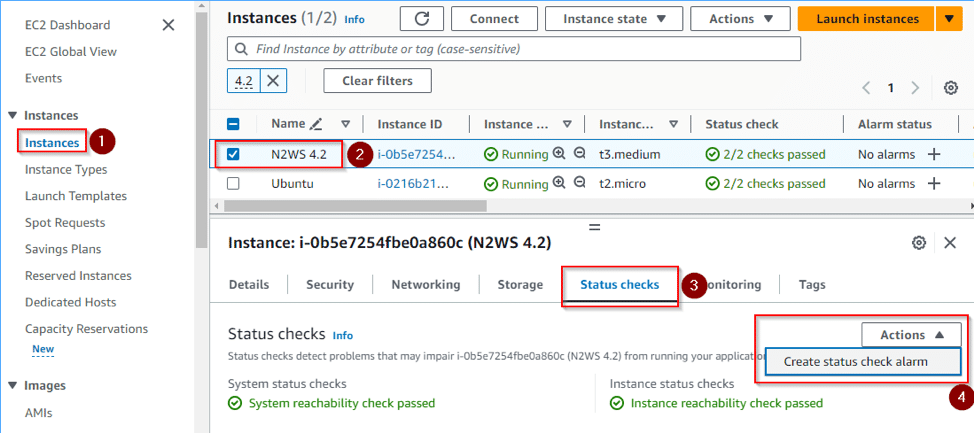
Step 1: Open the Amazon EC2 console, select N2W server.
Step 2: Click on the Status Checks tab, and then on Actions, and Create status check alarm.
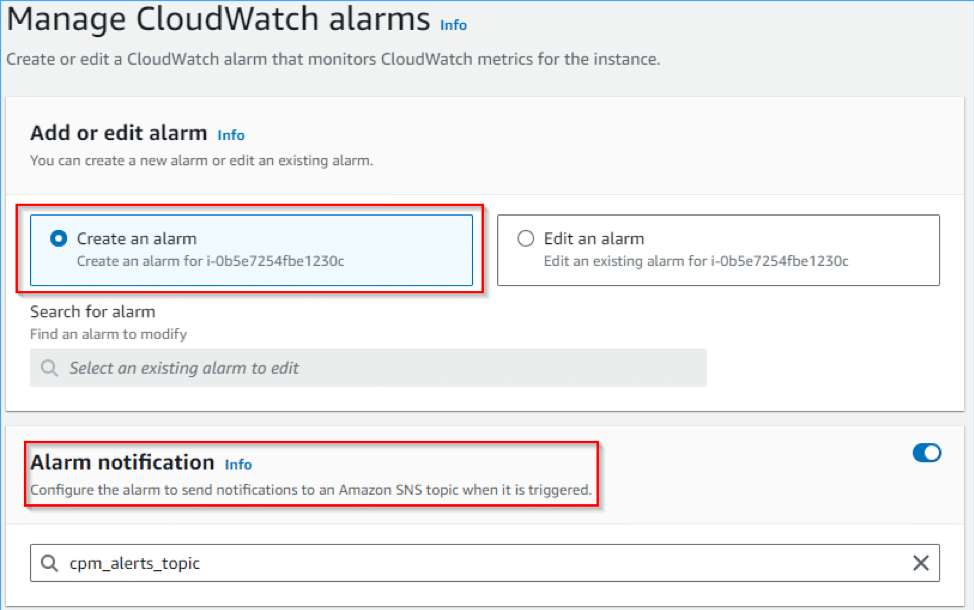
Step 3: Under Add or edit alarm, choose Create an alarm.
Step 4: Under Alarm notification, select an existing SNS topic to use to send notifications
Note: If you don’t have an SNS topic to use, you can learn how to create one here.
Step 5: Under Alarm thresholds, you can keep the default setting and then click create.
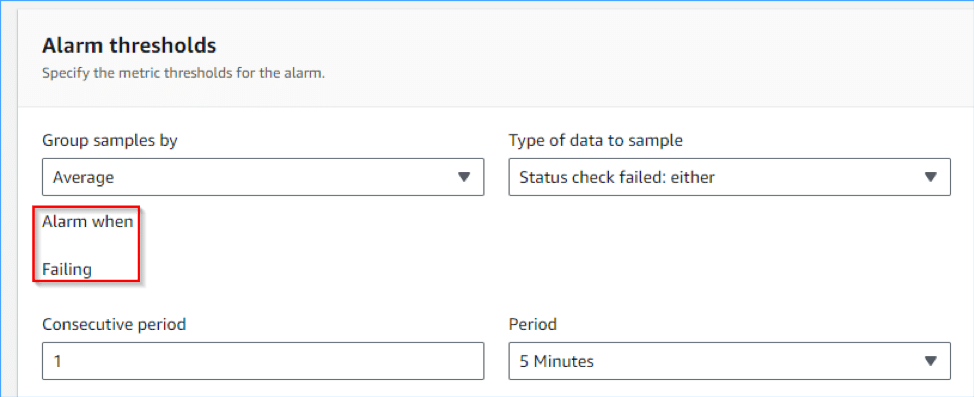
You should now have an alarm in place that will send notification to the selected SNS topic in case the N2WS EC2 has a status check issue.
2. Set up a disk space alarm
AWS does not collect data, such as disk space usage, from within the operating system by default. It only collects data available from outside, such as CPU utilization. So, to set a disk usage alarm, we first need to install the CloudWatch agent inside the N2WS server to collect disk usage metric and then we can set an alarm based on that custom metric.
Adding permissions
NOTE: This permissions step is based on the AWS documentation here.
Step 1: Select the N2WS Server, and click on the role.
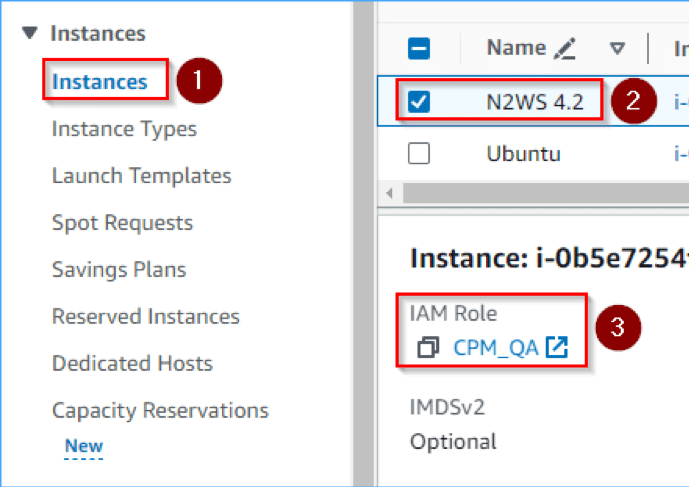
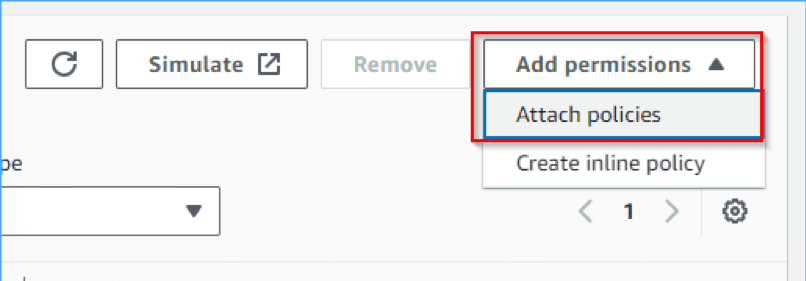
Step 2: Click on Add permissions -> Attach policies
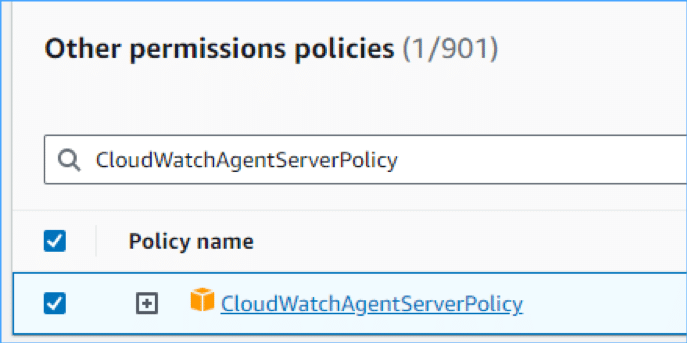
Step 3: Add the “CloudWatchAgentServerPolicy” permission to the role
Installing the CloudWatch agent
NOTE: This installation step is based on the AWS documentation here.
Step 1: Connect to the N2WS instance using SSH, with the user cpmuser and your selected key.
Step 2: Run the following command.
sudo su cd /tmp
wget https://amazoncloudwatch-agent.s3.amazonaws.com/ubuntu/amd64/latest/amazon-cloudwatch-agent.deb
sudo dpkg -i -E ./amazon-cloudwatch-agent.deb
Agent Configuration
NOTE: This configuration step is based on the AWS documentation here.
Step 1: Edit or create the configuration file, using the JSON command below.
sudo vi /opt/aws/amazon-cloudwatch-agent/etc/amazon-cloudwatch-agent.json

{
  "agent": {
    "metrics_collection_interval": 300,
    "run_as_user": "cwagent"
  },
  "metrics": {
    "append_dimensions": {
        "InstanceId": "${aws:InstanceId}"
    },
    "metrics_collected": {
      "disk": {
        "measurement": [
          "disk_used_percent"
        ],
        "metrics_collection_interval": 300,
        "resources": [
          "/","/cpmdata"
        ]
      }
    }
  }
}
Step 2: Save the JSON and exit.
This JSON will tell CloudWatch to collect metrics every 5 minutes for the root (/) and cpm data volumes (/cpmdata).
Step 3: After setting this, restart the CloudWatch agent with the command below and wait 30 minutes.
sudo systemctl restart amazon-cloudwatch-agentAfter 30 minutes, go to the CloudWatch service and verify that you can see the new custom metric.
Step 4: Go to CloudWatch -> All metrics -> CWAgent
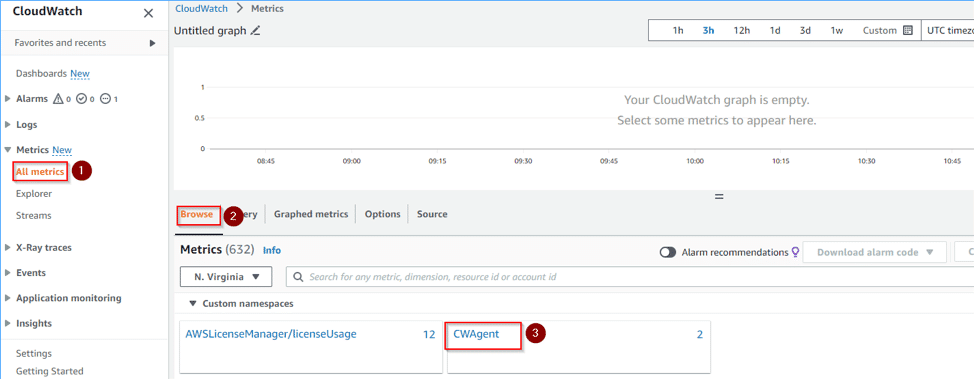
Step 5: Click on instanceID

Step 6: Now you will be able to see the collected metrics for both volumes.

NOTE: If something doesn’t work, you can check out this CloudWatch troubleshooting doc.
Setting an alarm
Now that we’ve created this new metric, we can continue to create an alarm. This way, if the disk usage percent goes above a certain threshold, we’ll get an alert.
Step 1: Select one of the metrics, then click on Create alarm.

Step 2: Scroll down to the conditions and select Greater. Then enter a number for your alert threshold, for example greater than 85%.
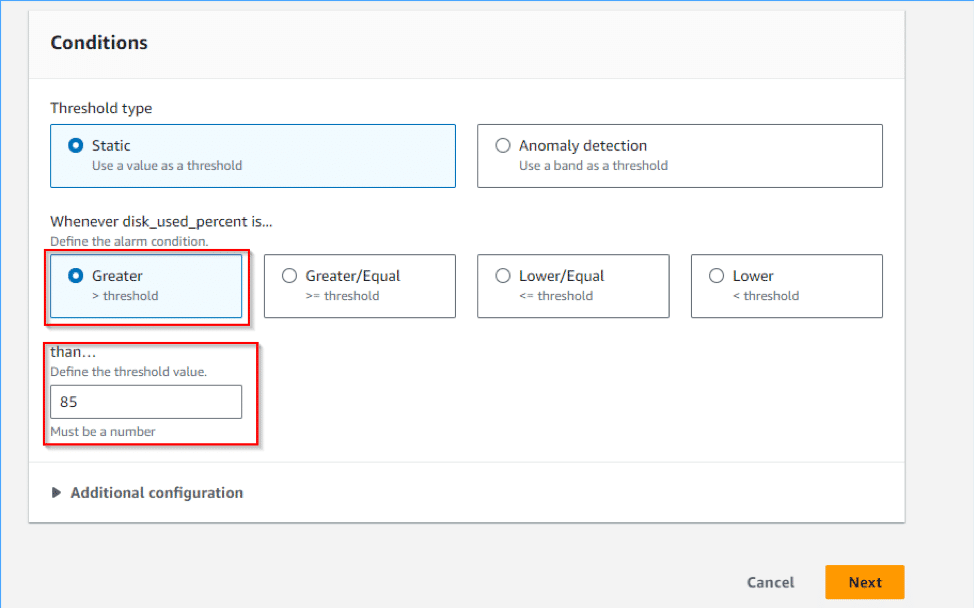
Now we need to select the SNS topic the alert will be sent to.
Step 3: Select an alarm and then select an existing SNS topic.
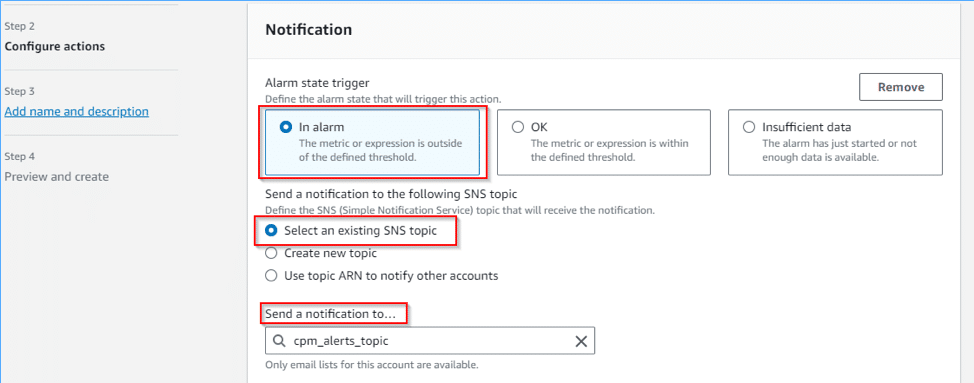
Step 4: Now we need to add an alarm name and description.
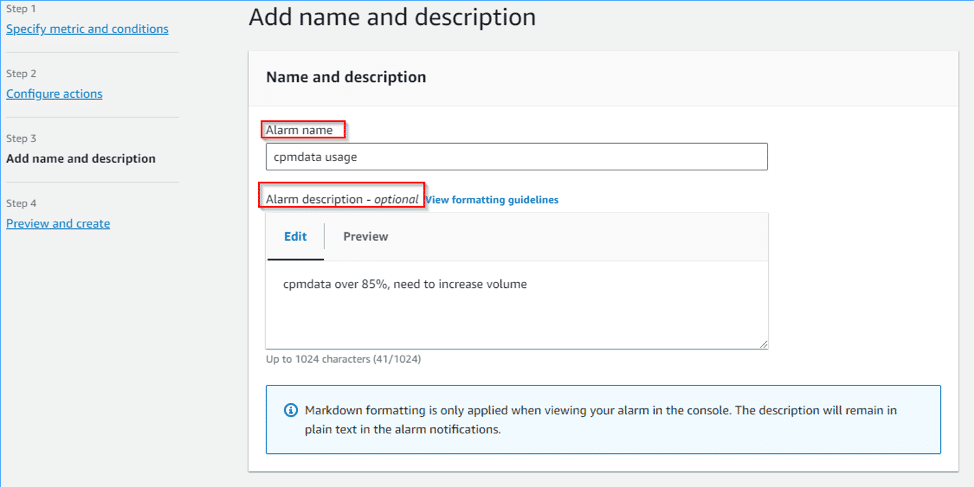
Step 5: Click next and create then alarm.
You can repeat this process for the other metric we created so that you have alarms for both disks.
Testing the alarm
Because years can pass before you have a real alarm due to disk space usage, it’s best practice to test the alarm to be 100% sure that it will work as expected. To test it, we first need to check the current usage.
Step 1: Go to your metrics -> CWAgent -> instanceid
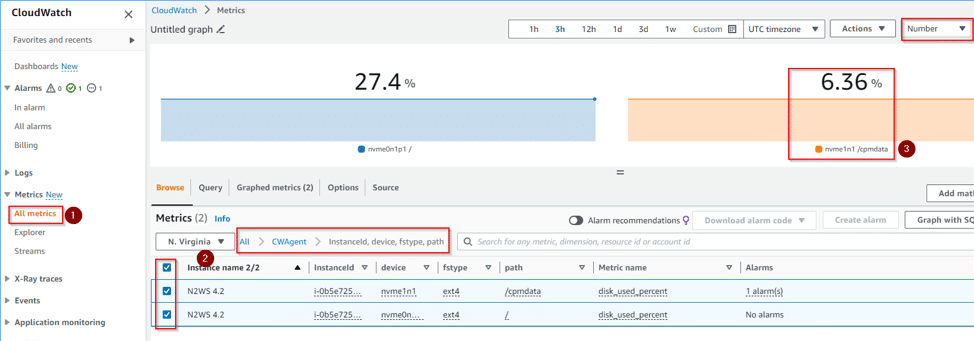
Now that we know what the current values are, we can set the alarm to a lower number in order to force the alarm to trigger.
Step 2: Go to All alarms -> click on the N2W data Alarm
Step 3: Click on Actions -> Edit
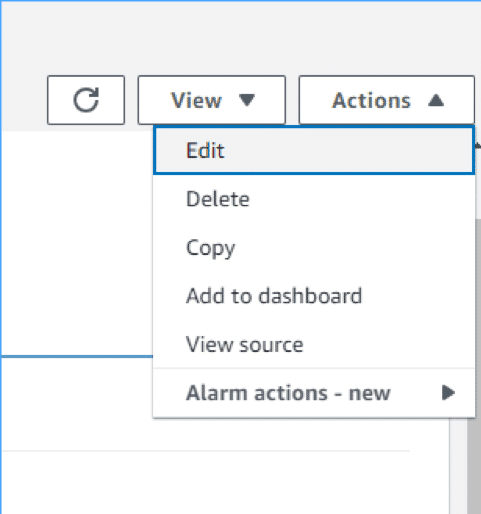
Step 4: Set the value to a lower number than the current usage (e.g. if your usage is 6%, set the alarm to 3% for testing).
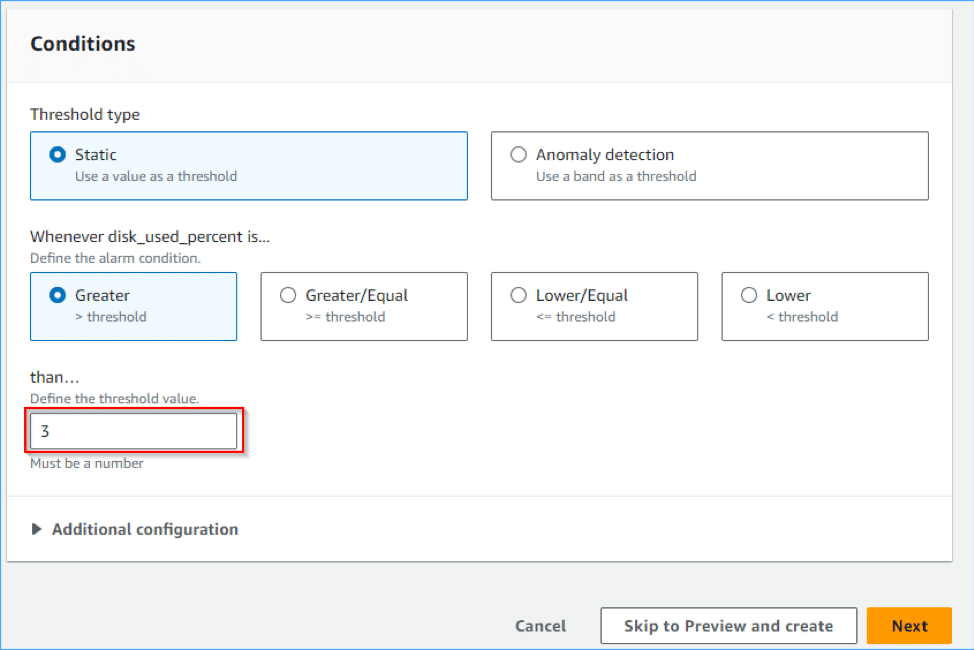
Step 5: Save the changes and wait 15-20 minutes.
Step 6: Check your CloudWatch Alarms to verify that the volume is in an “alarm” state. When the alarm is triggered, an email should also be sent to the configured SNS topic.
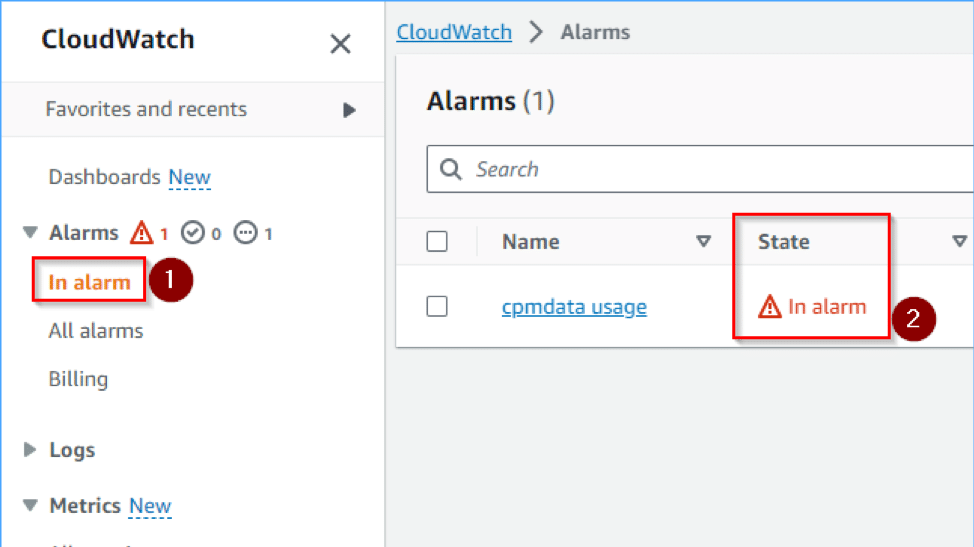
Step 7: Finally, after verifying that the alarm works, change the alarm back to its original threshold value.
You can repeat this process to test the other alarm as well. And then you’re done! You can rest easy knowing that if this error ever happens, you’ll be alerted about it right away.

Adi is our N2WS Technical Support hero, leading our international support team. He has over a decade of experience working with cloud customers to solve their technical challenges. He's a self-taught AWS, Azure and Python wizard.