In part one of this series, we started with an overview of Amazon Relational Database Service and its features, focusing mainly on security. We looked at some of the best practices for securing access to your RDS database, as well as how best to protect your data using encryption.
Below, we switch our focus to monitoring, a crucial component in any production environment. We introduce Amazon’s service for monitoring an AWS infrastructure and show how it can provide the necessary information about your RDS database, allowing you to achieve and maintain a cost-effective cloud environment.
Automatic Monitoring Your RDS Instances with Amazon Cloudwatch
Monitoring your RDS instances offers insight into your database performance, permitting you to optimize its functionality, without producing excess costs. For infrastructure monitoring on AWS, Amazon offers CloudWatch, a diverse service that provides visibility of utilization, ut also monitors the health of your resources such as EC2, ELB, RDS, DynamoDB, and others. It can collect and monitor various metrics, create alarm notifications, and respond to specific events. CloudWatch offers standard monitoring as a default and sends metrics every five minutes.
There is also the option to enable enhanced monitoring if more details are required. Out of the box, CloudWatch standard monitoring provides various metrics for RDS, ranging from CPU, memory, and disk usage (which are the same for most instances), to more specific ones such as DB connections, I/O/latency/throughput, and replica lag. Formerly, CloudWatch metrics could be stored for only 14 days, but Amazon introduced an update in November 2016 that increased the storage retention for all metrics to 15 months at no extra charge. This is particularly useful when looking at long-term patterns of your database utilization.
Fortify your cloud across every critical dimension.
- Efficiency + Optimization
- Security + Control
- Orchestration + Visibility

CloudWatch Alarm System
The ability to view various metrics for your database is important, but you also need a system in place that will notify you if something goes (or is about to go) wrong. CloudWatch does so very effectively using an alarm system. You can create alarms for just about any metric by defining thresholds and specifying actions to be taken when needed. For example, you might want to be notified if your disk usage rises higher than 80%. You can also use alarms to achieve automation, like stopping your database when the work is complete, based on the number of database connections, or CPU usage.
You can learn how to monitor an EBS volume’s performance by identifying which metrics to perform, how to create notifications and finally execute your Cloudwatch alarm. With CloudWatch, you can create event notifications and monitor your database for events such as backup fails, modification, failovers, and others.
Manual Monitoring using your Amazon RDS Dashboard
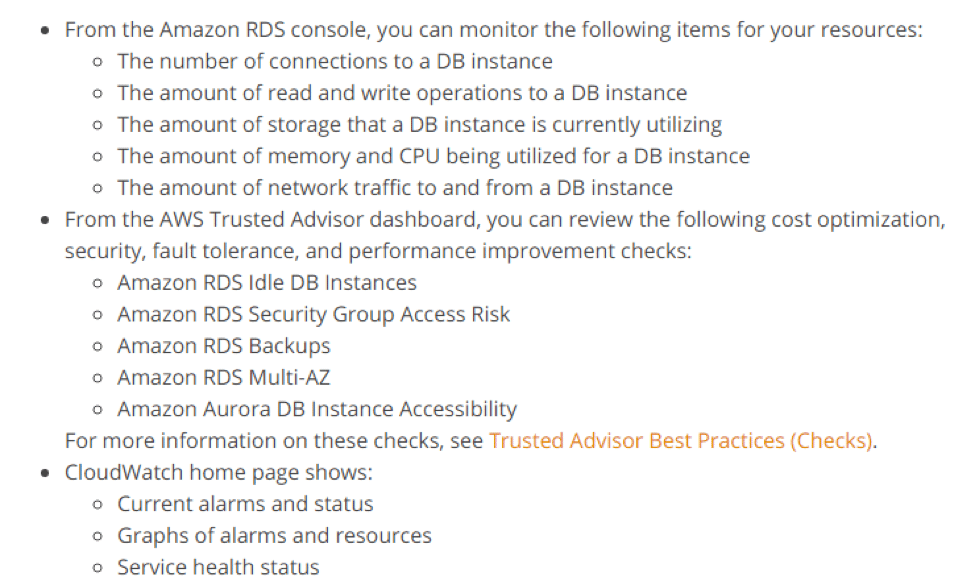
As Cloudwatch alarms don’t cover all items, it’s important to take advantage of manual monitoring tools like AWS Trusted Advisor and AWS RDS which we will discuss here. Both of these tools provide a direct glance into how your DB instances and clusters are functioning. After choosing DB Instances in the navigation pane, you can choose to view your metrics in a multi-graph view, a single graph view, or latest metrics view:
- Multi-Graph View shows a full summary of your DB instance metrics including graphs. Some samples of graphs include CPU Utilization, DB Connections, Free Storage Space, Write IOPS, Read IOPS, and Queue Depth.
- Single Graph View shows your instance metrics one at a time with more detail, each with a graph of your choosing as well as over a specified a time period.
- Latest Metrics View does not show graphs but does provide a summary of metrics.

A full list of items that you can monitor from your dashboard is further explained here.
Enhanced Monitoring for RDS
One downside of standard monitoring is that relies only on what the hypervisor can see, which is a pretty limited view. Enhanced monitoring, on the other hand, depends on an agent that is installed on the operating system of each instance, and can gather far more information compared to standard monitoring. It provides around 50 metrics for a database and allows you to choose the granularity of metrics collected down to one second.
The extra functionality does, however, come at an extra cost. Enhanced monitoring is available for all six database engines and on almost all database instance classes (the exception being db.m1.small). Enhanced monitoring may be enabled on a per-instance basis during database provisioning or later while modifying using a web console or API.
Final Note
CloudWatch provides many options for AWS resource monitoring and RDS benefits greatly from it. With numerous metrics to track the performance of your database, and notifications to inform you when thresholds are breached, you can rest assured that nothing untoward will go unnoticed. The ability to create responses to alarms and events is a benefit not only in achieving automation, but also keeping your database utilization optimized at all times.
If basic monitoring won’t fulfill your cloud environment needs, you can always use enhanced monitoring as an option. In part three, we move into multi-availability-zone configurations for RDS and see how we can achieve high availability for your RDS database.
N2WS Backup & Recovery for RDS and more
N2WS Backup & Recovery gives you the ability to backup your environment as often as needed and recovery it far more quickly than with traditional backup solutions. Using N2W you can create backup policies and schedules for RDS databases, EC2 instances, independent EBS volumes, RDS Aurora clusters and Redshift clusters.